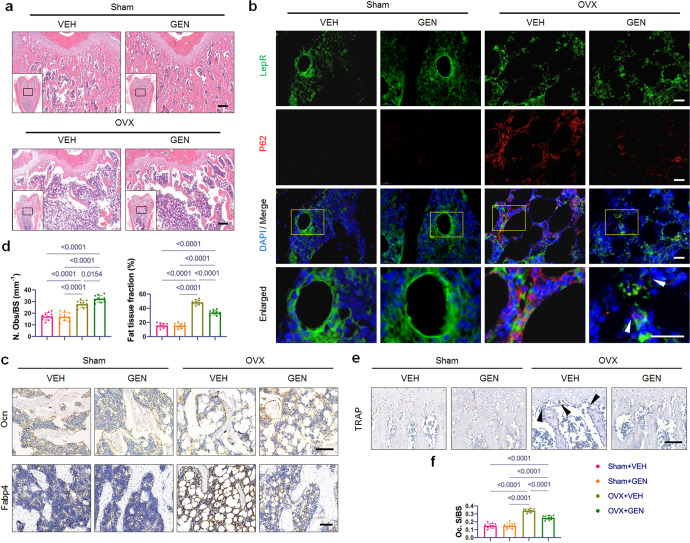
Fig. 2. Genistein treatment reversed trabecular bone loss and abnormal autophagy induced by ovariectomy.
a Representative images of H&E-stained distal femur sections. Scale bar, 200 μm. b Representative images of double immunofluorescence labeling of P62 and LepR at the bone marrow area of distal femur. Yellow boxes indicate the area of high magnification on the up panel. White arrowheads indicate the dots of P62. Scale bar, 20 μm. c Representative images of immunohistochemistry for Ocn and Fabp4. Scale bar, 100 μm. The results of quantitative measurements of osteoblasts and fat tissue are presented on (d) (n = 10/group). N. Obs/BS, number of osteoblasts per bone surface. e, f TRAP staining and quantification of Oc.S/BS (osteoclast surface per bone surface). Black arrowheads indicate osteoclasts. Scale bar, 100 μm. n = 10/group. Data were shown as means with SD, and all data points. One-way ANOVA followed by Tukey post hoc test was used in d and f.

