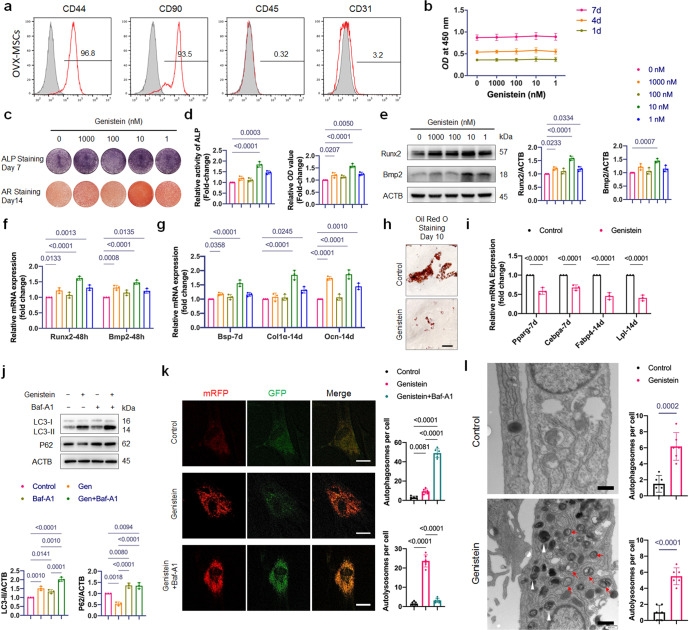
Fig. 3. Effects of genistein on proliferation, lineage commitment and autophagy of OVX-MSCs.
a Flow cytometric analysis of cell surface markers on OVX-MSCs. The gray histogram represented isotype control cells and the red histogram represented the cells incubated with the indicated antibodies (CD44, CD90, CD45 and CD31). b The effect of genistein at different concentrations (1–1000 nM) on the proliferation of OVX-MSCs was evaluated (n = 3). c, d OVX-MSCs were treated with genistein at different concentrations (1–1000 nM) for 48 h, then cultured in osteogenic medium for the indicated time periods. ALP staining and Alizarin Red staining, as well as ALP activity assays and quantitative analysis of the Alizarin Red staining were performed (n = 3). Genistein significantly increased ALP activity and bone nodule formation in OVX-MSCs. e Western Blot assay was performed to detect the Runx2 and Bmp2 expression in OVX-MSCs treated by genistein for 48 h. Representative Western blots and densitometric quantifications are shown (n = 3). f Real-time qPCR assay was performed to examine changes in the mRNA expression of the master osteogenic transcription factors including Runx2 and Bmp2 (n = 3). g Real-time qPCR assay was performed to examine changes in expression of osteoblastic differentiation marker genes including Bsp, Col1α and Ocn (n = 3). h, i OVX-MSCs were treated with or without 10 nM genistein for 3 days, then cultured in adipogenic inducing medium for the indicated time periods. The results of Oil-Red-O staining and qRT-PCR showed that the genistein significantly inhibited adipogenesis of OVX-MSCs (n = 3). Scale bar, 100 μm. j OVX-MSCs were treated by genistein in the presence or absence of bafilomycin A1 (Baf-A1, 10 nM) for 48 h, Western blot analysis was performed to detect the LC3-II and P62 expression. Representative Western blots and densitometric quantifications are shown (n = 3). k Representative confocal images of OVX-MSCs transfected with lentivirus containing mRFP-GFP-LC3 construct. Cells were treated with genistein in the presence or absence of Baf-A1 for 36 h. Red puncta (i.e., RFP+GFP-) indicated autolysosomes, and yellow puncta (i.e., RFP+GFP+) indicated autophagosomes. Quantitative measurements of autolysosomes and autophagosomes are shown on right (n = 6 cells/group). Scale bar, 20 μm. l Autophagic vacuoles were observed by transmission electron microscopy in cells treated with genistein for 36 h. Red arrows indicate typical autophagosomes, which characterized by 2 bilayers separated by a narrow electron-lucent cleft. White arrowheads indicate autolysosomes, which can be identified as one limiting membrane structure containing electron dense cytoplasmic material and/or organelles at various stages of degradation. Scale bar, 500 nm. Statistical analysis was performed to calculate the number of autophagosomes and autolysosomes in cells (n = 6 cells/group). Data were shown as means with SD, and all data points. One-way ANOVA followed by Tukey post hoc test was used in b, d, e–g, j, and k. Unpaired Student’s t-test was used in i and l.

