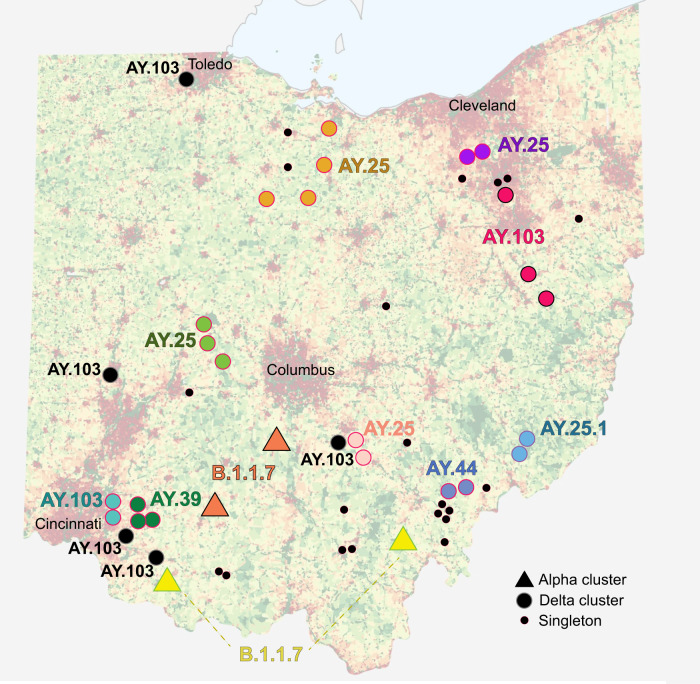
Fig. 3. Map of SARS-CoV-2 transmission clusters in Ohio white-tailed deer.
Each shape represents a county in Ohio where SARS-CoV-2 virus was identified in WTD for this study (triangle = alpha variant; circle = delta variant). Large circles indicate WTD transmission clusters, as identified on the phylogenetic tree (black = clusters restricted to one county; shaded = clusters identified in more than one county). Large circles shaded the same color belong to the same transmission cluster. Small black circles indicate singleton WTD viruses. PANGO lineage provided for all clusters. Human population density is shown in the background (red = high; green = low) and major cities are labeled. Ohio population map [created by JimIrwin, from Wikimedia Commons] was used with modification under CC BY-SA 3.0 license.

