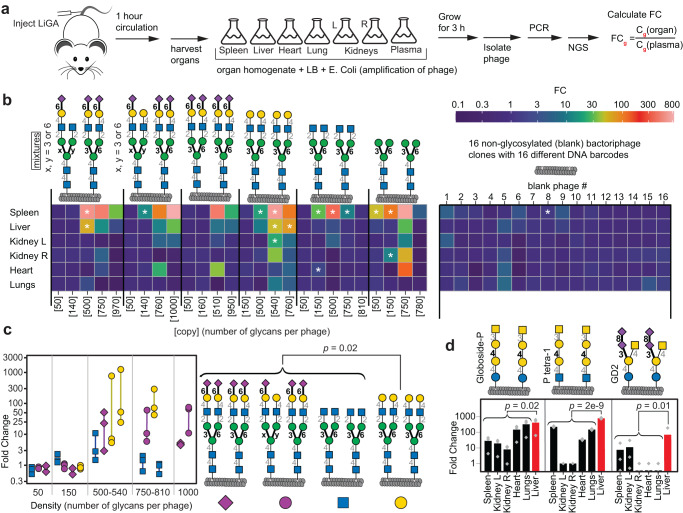
Fig. 6. Interaction of LiGA with organs in vivo.
a LiGA was injected (tail vein) into mice (n = 3 animals). After 1 h, mice were perfused with saline and euthanized. Plasma and organs were collected; organ homogenates and plasma were incubated with E. coli for 3 h to amplify the phage, followed by PCR and NGS of phage DNA. Fold change (FC) between organ and plasma was calculated by edgeR after normalizing by scaling the unmodified phages to unity, and multi-test control by FDR from B-H correction. b Heatmap of the enrichment of N-glycan-decorated and unmodified (blank) phages in organs. Asterisks designate enrichment with FDR 0.05. See Supplementary Figs. 50–56 for detailed summaries per organ. c Focusing only on the liver data in the heatmap, we summarize enrichment of the four classes of N-glycans, n = 3 data points represent data from n = 3 animals. Fold changes for each glycan in the liver broken down by glycan density. A Mann-Whittney U-test (two-sided) indicates significant (p = 0.02) enrichment in the liver of phages with galactose-terminated N-glycans when compared to GlcNAc-terminated and completely or partially sialylated N-glycans. d Phage decorated by three glycans with terminal GalNAc that show significant enrichment (FDR 0.05) in liver, p-values from a Fisher (standard) ANOVA test when compared to other organs. See Supplementary Fig. 51 for summary of other glycans enriched in liver (vs. plasma).

