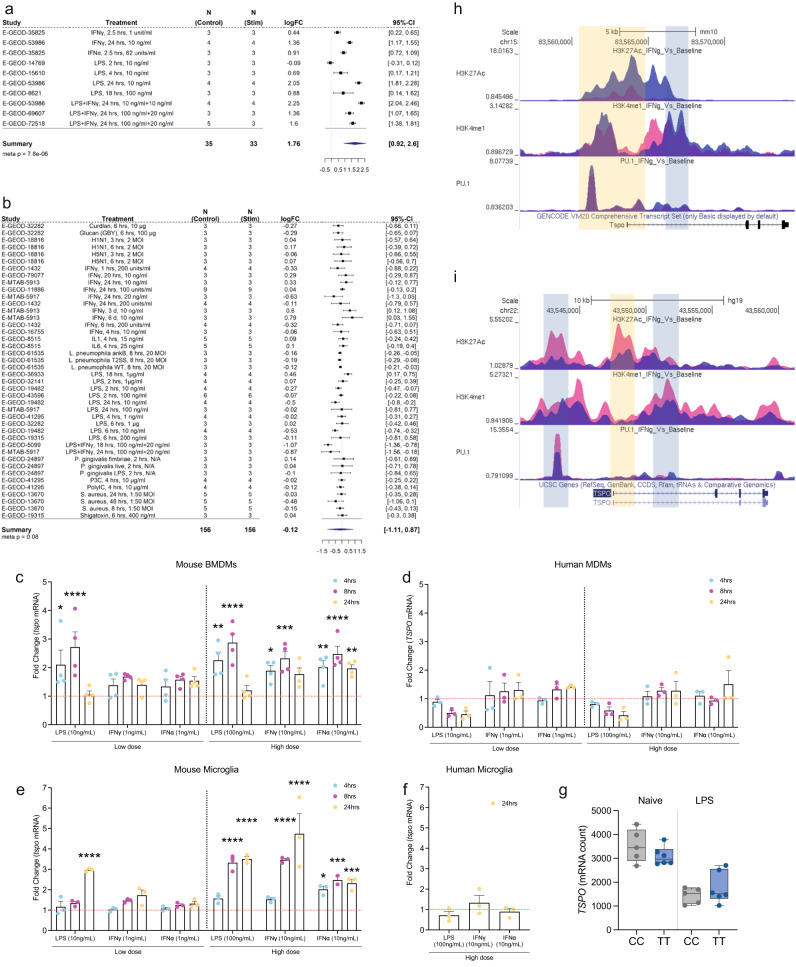
Fig. 1. TSPO gene expression and epigenetic profile in human and mouse macrophages.
a, b Forest plot of the meta-analysis for TSPO expression in a mouse and b human myeloid cells treated with a pro-inflammatory stimulus. Statistical significance for individual dataset was done using linear model, the meta-analysis was performed using random-effect model (black square; logFC, horizontal lines; 95% CI, diamond; pooled logFC). c, d Fold change of TSPO mRNA in macrophages after stimulation indicating increases in tspo expression in mice but not in TSPO expression in humans. e, f An increase is observed in tspo expression after stimulation of mouse microglia but not in TSPO in human microglia. g TSPO mRNA count data from RNA sequencing of human monocytes isolated from healthy volunteers (with C/C and T/T genotype at the rs6971 locus) exposed to 100 ng/mL LPS for 24 h shows no effect of genotype on TSPO mRNA. h, i ChIP-seq data, generated from h mouse and i human myeloid cells treated with IFNγ, visualisation of histone modification peaks (H3K27Ac, K4me1) and PU.1 binding peaks at TSPO loci in IFNγ-treated (blue) and baseline (pink) conditions. Yellow vertical shading corresponds to the TSS along with promoter and light blue shading corresponds to the enhancer region of the loci. Biologically independent samples were used for all experiments (c–f n = 3 for all conditions, g n = 5 C/C and n = 6 T/T genotype). Statistical significance in (c–g) was determined by one-way ANOVA or Kruskal–Wallis test when not normally distributed or by a two-tailed unpaired t-test or two-tailed Mann–Whitney U-test when not normally distributed. Bar graphs indicate the mean ± SEM. Box and whiskers mark the 25th to 75th percentiles and min to max values, respectively, with the median indicated. Source data are provided as a Source data file.

