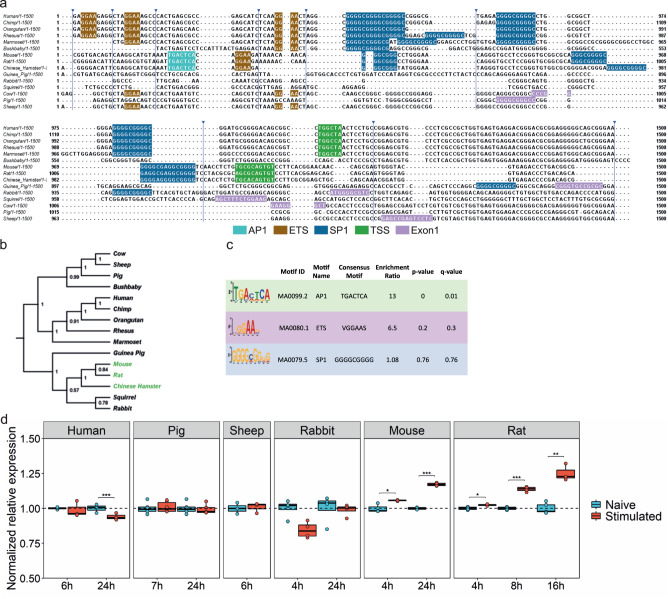
Fig. 2. AP1 binding site in the TSPO promoter and LPS inducible TSPO expression is unique to the Muroidea superfamily of rodents.
a Multiple sequence alignment of TSPO promoter region of 15 species from primate, rodent, non-primate mammals. AP1 (cyan) and an adjacent ETS (brown) site is present in only a sub-group of rodent family which includes mouse, rat, and Chinese hamster. The ETS site which binds transcription factor PU.1 is present across species. SP1 (blue) site is found in the core promoter close to the TSS (green). For species where the TSS is not known Exon1 (pink) location is shown. Blue arrowhead indicates sequence without any motif hidden for visualization. b Phylogenetic tree is showing a clear branching of rat, mouse, and Chinese hamster TSPO promoter from the rest of the species from rodents. Primates including marmoset forms a separate clade while sheep, cow and pig are part for the same branch. Green highlights represent species that contain the AP1 site in TSPO promoter. Phylogenetic tree was generated using the Maximum Parsimony method in MEGA11. The most parsimonious tree with length = 4279 is shown. The consistency index (CI) is 0.760458 (0.697014) and the retention index is 0.656386 (RI) (0.656386) for all sites and parsimony-informative sites (in parentheses). The percentage of replicate trees in which the associated taxa clustered together in the bootstrap test (1000 replicates) are shown next to the branches. c Differential motif enrichment analysis between rodent vs non-rodent TSPO promoter region by SEA tools from MEME-suite confirms the significant enrichment of AP1 site in rodent promoter whereas SP1 site does not show any differential enrichment (Fisher’s exact test was used to determine enrichment ratio and p-value, q-value was calculated by Benjamini & Hochberg method). TSS; Transcription start site. d TSPO gene expression in macrophages or microglia isolated from multiple species after LPS stimulation. In line with the multiple sequence alignment of the TSPO promoter, species (mouse, rat) that contains an adjacent AP1 and ETS (PU.1) motif shows an upregulation of TSPO gene after LPS stimulation. Species lacking (human, pig, sheep, rabbit) those sites show a downregulation or no change in expression after stimulation. Biologically independent samples were used for all experiments (d rabbit, rat, pig n = 4 and human, mouse, sheep n = 3 for all conditions). Box and whiskers mark the 25th to 75th percentiles and min to max values, respectively, with the median indicated. Source data are provided as a Source data file.

