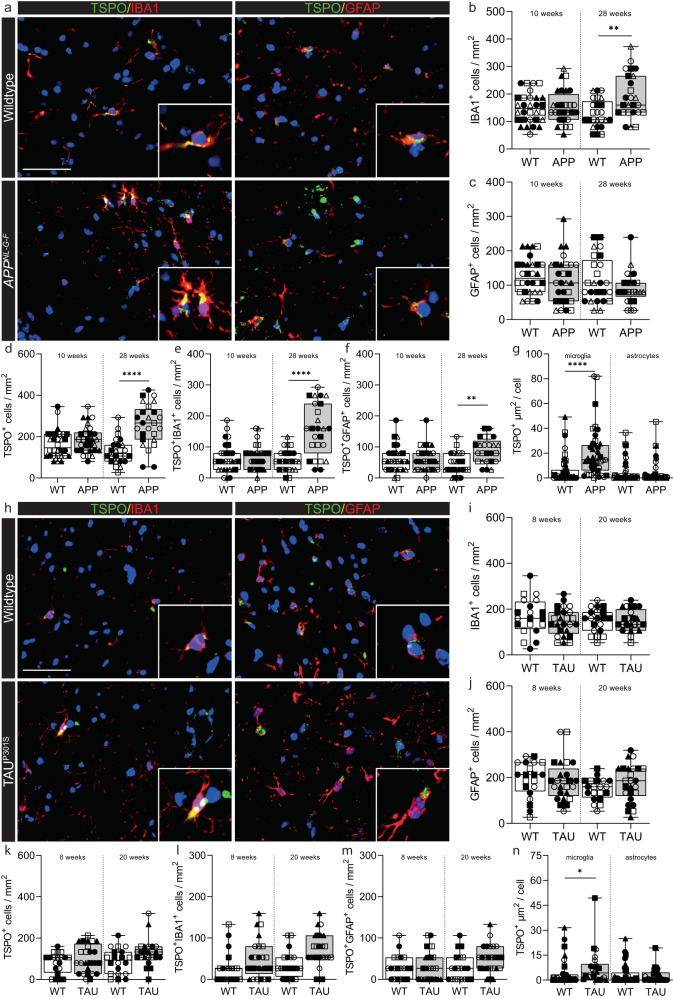
Fig. 5. Microglia in the AppNL-G-F and TAUP301S model increase TSPO expression.
a Representative images of TSPO expression in microglia and astrocytes in AppNL-G-F hippocampus. b An increase was observed in IBA1+ microglia at 28 weeks (P = 0.0078, t = 3.522, df = 8) but not 10 weeks (P = 0.8788, t = 0.1565, df = 10) in AppNL-G-F hippocampus compared to control. c No increase in astrocytes was observed (10 weeks: P = 0.6266, t = 0.5019, df = 10; 28 weeks: P = 0.4425, t = 0.8080, df = 8). d TSPO+ cells were increased at 28 weeks (P = 0.0079, U = 0, ranks = 15, 40) but not at 10 weeks (P = 0.2375, t = 1.257, df = 10) in the AppNL-G-F mice. e, f Both TSPO+ microglia (P = 0.0005, t = 5.658, df = 8) and astrocytes (P = 0.0030, t = 4.207, df = 8) were increased at 28 weeks in the hippocampus of AppNL-G-F mice but not at 10 weeks (microglia: P = 0.7213, t = 0.3670, df = 10; astrocytes: P = 0.9561, t = 0.056, df = 10). g Activated microglia (P < 0.0001, t = 7.925, df = 8), but not astrocytes (P = 0.3095, U = 7, ranks = 33, 22), in the AppNL-G-F model have increased TSPO expression at 28 weeks. h Representative images of TSPO expression in microglia and astrocytes in TAUP301S hippocampus. i–k No increases in microglia (8 weeks: P = 0.3687, t = 0.9608, df = 7; 20 weeks; P = 0.9647, t = 0.04580, df = 7), astrocytes (8 weeks: P = 0.7353, t = 0.3519, df = 7; 20 weeks; P = 0.0870, t = 1.989, df = 7) or TSPO+ cells (8 weeks: P = 0.8492, U = 9, ranks = 19, 26; 20 weeks; P = 0.0876, t = 1.985, df = 7) were observed in the hippocampus of TAUP301S mice. l, m No increase was observed in the number of TSPO+ microglia (8 weeks: P = 0.2787, t = 1.174, df = 7; 20 weeks; P = 0.0907, t = 1.961, df = 7) or astrocytes (8 weeks: P = 0.8684, t = 0.1718, df = 7; 20 weeks; P = 0.1984, U = 4.5, ranks = 14.5, 30.5). n Microglia in the TAUP301S increase TSPO expression (P = 0.0133, t = 3.471, df = 6) whereas astrocytes do not (P = 0.5800, t = 0.5849, df = 6). Biologically independent samples were used for all experiments (b–g 10 weeks: n = 6 WT and n = 6 AppNL-G-F, 28 weeks: n = 5 WT and n = 5 AppNL-G-F) (i–n 8 and 20 weeks: n = 4 WT and n = 5 TAUP301S). Statistical significance in (b–g) and (i–n) was determined by a two-tailed unpaired t-test or two-tailed Mann–Whitney U-test when not normally distributed. Box and whiskers mark the 25th to 75th percentiles and min to max values, respectively, with the median indicated. Scale bar = 50 µm, inserts are digitally zoomed in (200%). Each individual is represented by a different symbol. Source data are provided as a Source data file.

