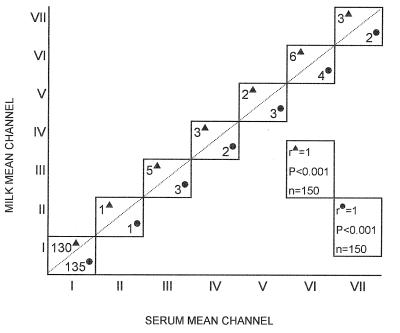
FIG. 2.
Correlation between serum and milk mean channel values for water buffaloes (▴) and cows (•) as measured by SCT. Animals were divided into the following groups: animals with serum and milk mean channel values ± standard deviations of 76 ± 1.7 (group I), 190 ± 3.6 (group II), 240 ± 6 (group III), 341 ± 7.8 (group IV), 425 ± 9.7 (group V), 578 ± 8.4 (group VI), and 757 ± 9.4 (group VII). n, number of animals tested.

