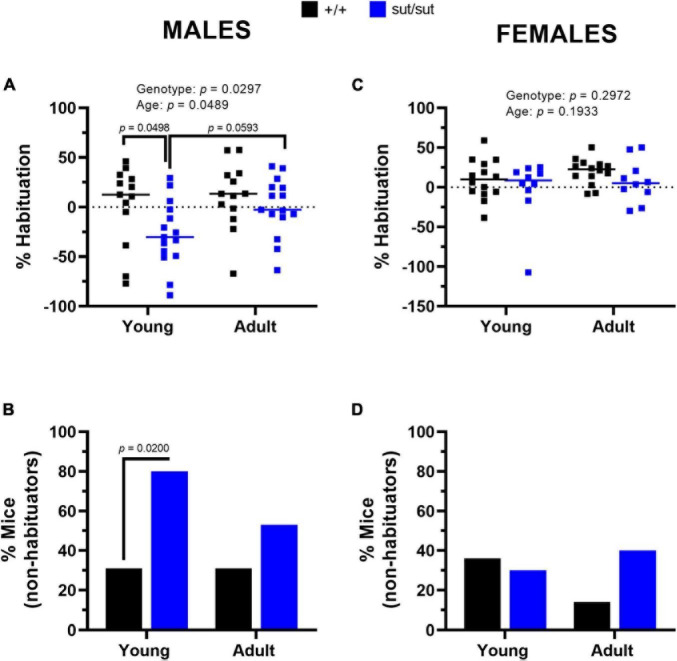
FIGURE 10.
Percent habituation. Male (A,B) or Female (C,D) SLC7A11+/+ (+ / + , n = 13M:14F, black) and SLC7A11sut/sut (sut/sut, n = 15M:10F, blue) littermates were tested at 2 (young) and at 6 months (adult). Each data point representing an individual animal is graphed with the median percent habituation (100 x [(mean startle amplitude on the first 6 trials - mean startle amplitude on the last 6 trials)/mean startle amplitude on the first 6 trials]) reflected by the horizontal line. Statistical analyses were performed on the habituation score [(mean startle amplitude on the last 6 trials)/(mean startle amplitude on the first 6 trials)] using MMRM ANOVA followed by Bonferroni’s multiple comparisons test. The number of non-habituating mice graphed as a percentage was analyzed using the Fisher’s exact test. Sex Differences: Percent habituation is disrupted in sut/sut male mice as compared to sut/sut female mice [F (1,48) = 4.301, p = 0.0435 for sex]. No sex differences were found in +/+ mice [F(1,48) = 0.7447, p = 0.3925 for sex]. (A) Habituation in males: F(1, 52) = 4.998, p = 0.0297, genotype; F(1, 52) = 4.066, p = 0.0489, age; F(1, 52) = 1.064, p = 0.3071, interaction. (+ / + vs sut/sut: p = 0.0498 for young, p = 0.7967 for adult) (young vs adult: p > 0.9999 for +/+ , p = 0.0593 for sut/sut). (B) Male non-habituator mice. Genotype: +/+ vs sut/sut (p = 0.0200 for young, p = 0.2761 for adult); Age: young vs adult (p > 0.9999 for +/+ , p = 0.2451 for sut/sut). (C) Habituation in females: F(1, 22) = 1.140, p = 0.2972, genotype; F(1, 22) = 1.801 p = 0.1933, age; F(1, 22) = 0.0386, p = 0.8461, interaction. (+ / + vs sut/sut: p > 0.9999 for young, p = 0.7085 for adult) (young vs adult: p = 0.5362 for +/+ , p = 0.8894 for sut/sut). (D) Female non-habituator mice. Genotype: +/+ vs sut/sut (p > 0.9999 for young, p = 0.1924 for adult); Age: young vs adult (p = 0.3845 for +/+ , p > 0.9999 for sut/sut).

