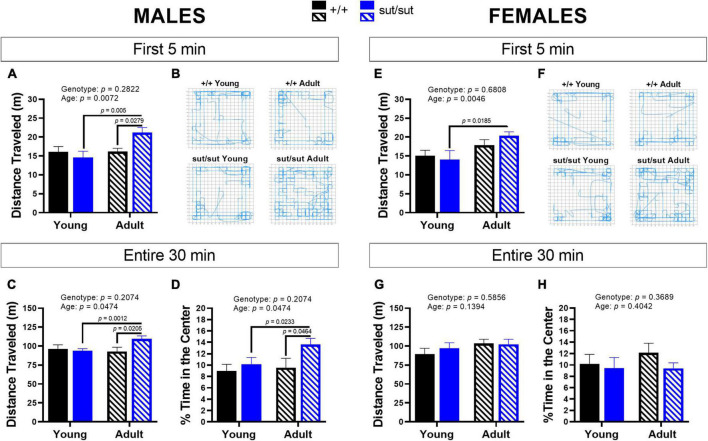
FIGURE 3.
Open field activity. Male (A–D) or Female (E–H) SLC7A11+/+ (+ / + , n = 13M:14F, black bars) and SLC7A11sut/sut (sut/sut, n = 15M:10F, blue bars) littermates were tested at 2 (young) or 6 months (adult). Ambulatory movement (distance traveled), central and peripheral activity (% time in center) of individual mice were measured. Data are plotted as mean + SEM and analyzed using MMRM ANOVA followed by the Bonferroni’s multiple comparisons test. No within genotype sex differences were found. (A) Distance traveled by males (5 min): F(1,26) = 8.520, p = 0.0072, age; F(1,26) = 1.206, p = 0.2822, genotype; F(1,26) = 8.078, p = 0.0086, interaction. (+ / + vs sut/sut: p = 0.9056 for young; p = 0.0279 for adult) (young vs adult: p = 0.0005 for sut/sut; p > 0.9999 for + / +). (B) Paths. Representative activity in of the first 5 min in the open filed by the same male mice at 2 (young) and 6 months (old). (C) Distance traveled by males (30 min): F(1, 26) = 4.333, p = 0.0474 age; F(1, 26) = 1.672, p = 0.2074, genotype; F(1, 26) = 10.4, p = 0.0034, interaction. (+ / + vs sut/sut: p > 0.9999 for young; p = 0.0205 for adult) (young vs adult: p = 0.0012 for sut/sut; p = 0.8836 for + / +). (D)% time in the center (30 min) – males: F(1, 26) = 3.513, p = 0.0722, age; F(1, 26) = 2.837 p = 0.1041, genotype; F(2,26) = 3.330, p = 0.0796, interaction. (+ / + vs sut/sut: p > 0.9999 for young; p = 0.0464 for adult) (young vs adult: p = 0.0233 for sut/sut; p > 0.9999 for + / +). (E) Distance traveled by females (5 min): F(1,22) = 9.944, p = 0.0046, age; F(1,22) = 0.1738, p = 0.6808, genotype; F(1,22) = 1.450, p = 0.2412, interaction. (+ / + vs sut/sut: p > 0.9999 for young; p = 0.5801 for adult) (young vs adult: p = 0.0185, for sut/sut; p = 0.2907 for + / +). (F) Paths. Representative activity in of the first 5 min in the open filed by the same female mice at 2 (young) and 6 months (old). (G) Distance traveled by females (30 min): F(1,22) = 2.352, p = 0.1394, age; F(1,22) = 0.3062, p = 0.5856, genotype; F(1,22) = 0.7756, p = 0.3880, interaction. (+ / + vs sut/sut: p = 0.6685 for young; p > 0.9999 for adult) (young vs adult: p > 0.9999 for sut/sut; p = 0.1497 for + / +). (H)% time in the center (30 min) – females: F(1, 22) = 0.7235, p = 0.4042, age; F(1, 22) = 0.8414, p = 0.3689, genotype; F(2, 22) = 0.3583, p = 0.5555, interaction. (+ / + vs sut/sut: p > 0.9999 for young; p = 0.5748 for adult) (young vs adult: p > 0.9999 for sut/sut; p = 0.5475 for + / +).

