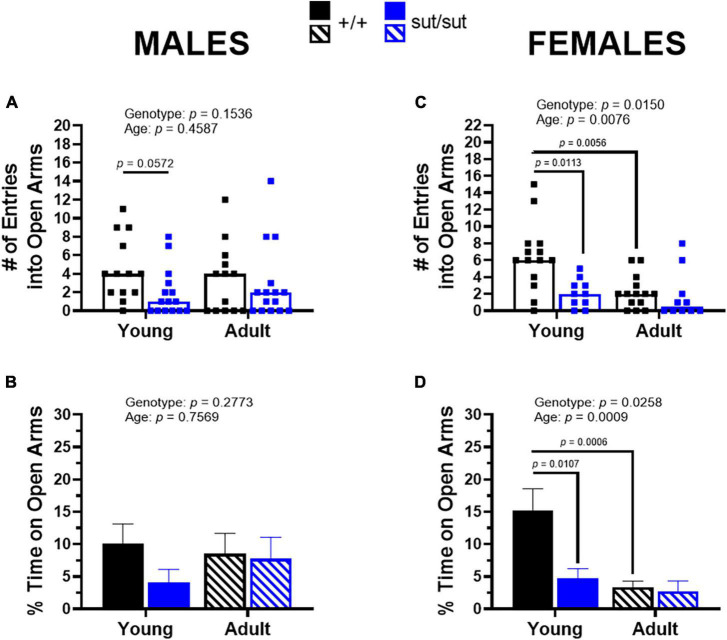
FIGURE 5.
Elevated plus maze. Male (A,B) or Female (C,D) SLC7A11+/+ (+ / + , n = 13M:14F, black) and SLC7A11sut/sut (sut/sut, n = 15M:10F, blue) littermates were tested at 2 (young) or 6 months (adult). Each data point representing an individual animal is graphed with the median number of entries reflected by horizontal line of the bar. The% time spent on the open arms is graphed as mean + SEM. Following transformation, data were analyzed via MMRM ANOVA followed by Bonferroni’s multiple comparisons test. No within genotype sex differences were found. (A) Number of entries — males: F(1, 26) = 2.160, p = 0.1536, genotype; F(1, 26) = 0.5658, p = 0.4587, age; F(1, 26) = 3.933, p = 0.0580, interaction. (+ / + vs sut/sut: p = 0.0572 for young; p > 0.9999 for adult) (young vs adult: p = 0.1460 for +/+ ; p = 0.7493 for sut/sut). (B)% time on open arms — males: F(1, 26) = 1.231, p = 0.2773, genotype; F(1, 26) = 0.09789, p = 0.7569, age; F(1, 26) = 3.514, p = 0.0721, interaction. (+ / + vs sut/sut: p = 0.1489 for young; p > 0.9999 for adult) (young vs adult: p = 0.5917 for +/+ ; p = 0.2411 for sut/sut). (C) Number of entries — females: F(1, 22) = 6.967, p = 0.0150, genotype; F(1, 22) = 8.620, p = 0.0076, age; F(1, 22) = 1.979, p = 0.1734, interaction. (+ / + vs sut/sut: p = 0.0113 for young; p = 0.6044 for adult) (young vs adult: p = 0.0056 for +/+ ; p = 0.6554 for sut/sut). (D)% time on open arms — females: F(1, 22) = 5.716, p = 0.0258 genotype; F(1, 22) = 14.81. p = 0.0009, age; F(1, 22) = 2.891, p = 0.1031, interaction. (+ / + vs sut/sut: p = 0.0107 for young; p = 0.8191 for adult) (young vs adult: p = 0.0006 for +/+ ; p = 0.3473 for sut/sut).

