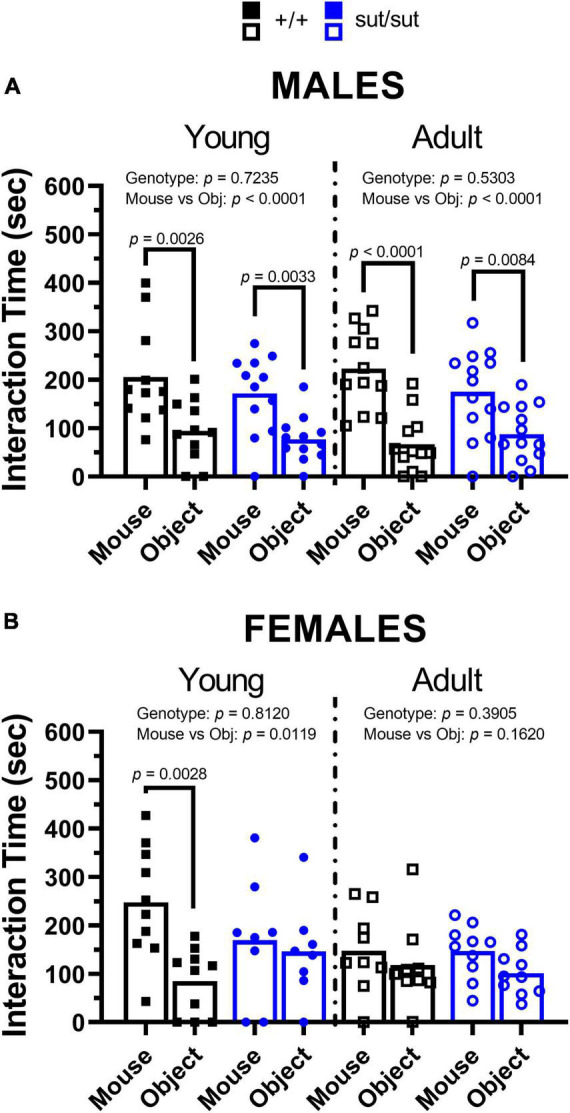
FIGURE 6.

3-chamber social test. Male (A) or Female (B) SLC7A11+/+ and SLC7A11sut/sut littermates were tested at 2 (young) [ +/+ , n = 11M:10F, black; sut/sut, n = 12M:8F, blue] and at 6 months (adult) [ +/+ , n = 13M:9F, black; sut/sut, n = 13M:10F, blue]. Each data point representing an individual animal is graphed with the mean interaction time reflected by horizontal line of the bar. Data were analyzed within each age group by two-way ANOVA followed by Bonferroni’s multiple comparisons test. (A) Time interacting with mouse vs object in males: Young: F(1, 42) = 20.78, p < 0.0001, mouse/object; F(1, 42) = 1.247, p = 0.2705, genotype; F(1, 42) = 0.1268, p = 0.7235, interaction. (mouse vs object: p = 0.0026 for +/+ , p = 0.0033 for sut/sut). Adult: F(1, 46) = 33.63, p < 0.0001, mouse/object; F(1, 46) = 0.3998, p = 0.5303, genotype; F(1, 46) = 2.644, p = 0.1108, interaction. (mouse vs object: p < 0.0001 for +/+ , p = 0.0084 for sut/sut). (B) Time interacting with mouse vs object in females: Young: F(1, 32) = 7.113, p = 0.0119, mouse/object; F(1, 32) = 0.0575, p = 0.8120, genotype; F(1, 32) = 3.995, p = 0.0542, interaction. (mouse vs object: p = 0.0028 for +/+ , p > 0.9999 for sut/sut). Adult: F(1, 34) = 2.043, p = 0.1620, mouse/object; F(1, 34) = 0.7565, p = 0.3905, genotype; F(1, 34) = 0.1070, p = 0.7456, interaction. (mouse vs object: p = 0.9054 for +/+ , p = 0.4212 for sut/sut).
