FIGURE 1.
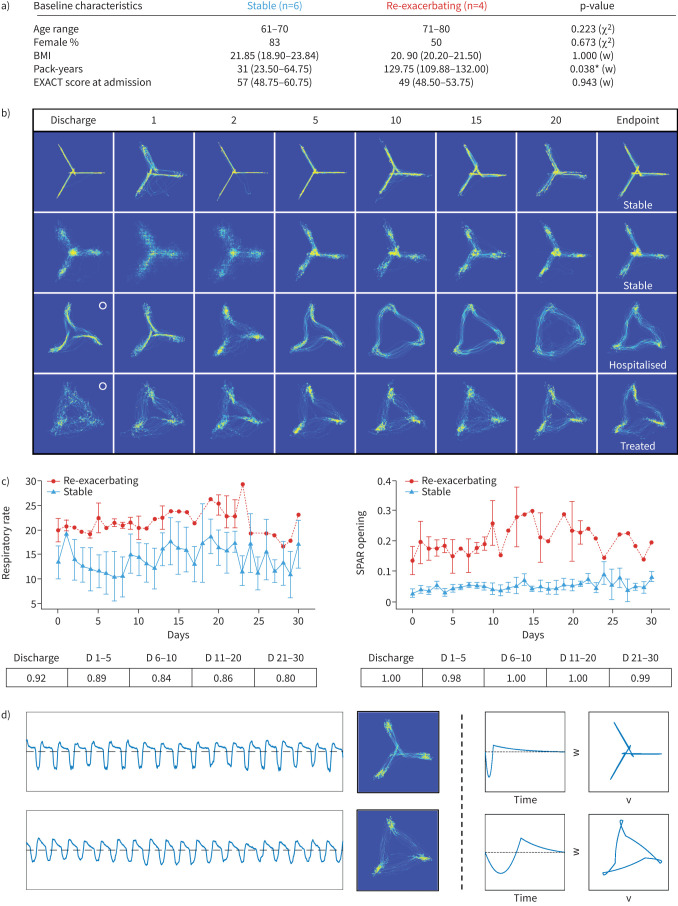
a) Baseline characteristics of studied patients, by group. Column labels indicate corresponding sample sizes. Age range=median years age range. Body mass index (BMI) (kg·m−2), pack-years and Exacerbations of Chronic Pulmonary Disease Tool (EXACT) score at admission are shown as median (interquartile range (IQR)). The last column shows p-values of a Chi-square (χ2) or Wilcoxon rank sum (w) test, comparing frequencies or median values of both groups, performed in MATLAB (MathWorks Ltd., Cambridge, UK). b) 60-s Symmetric Projection Attractor Reconstruction (SPAR) attractors of four different COPD patients, two stable (top) and two re-exacerbating (bottom) over the monitoring period (columns represent the approximate day of monitoring). o: start of attractor opening. c) Trajectories of respiratory rate and SPAR-Opening metrics over the 30-day monitoring period (median+IQR error bars). Tables below graphs indicate receiver operator characteristic area under the curve (ROC-AUC) classification performance values of the corresponding metrics during the different stages of the monitoring period (D: days). d) From left to right: example traces (60 s, ±0.5 mV, inhalation shown below dotted line), attractors (60 s, arbitrary units, size normalised) of day 2 recordings of a stable (top) and re-exacerbating (bottom) patient, in silico modelling of traces (arbitrary units) and attractors (arbitrary units) replicating changes observed in the two different groups. *: p<0.05.

