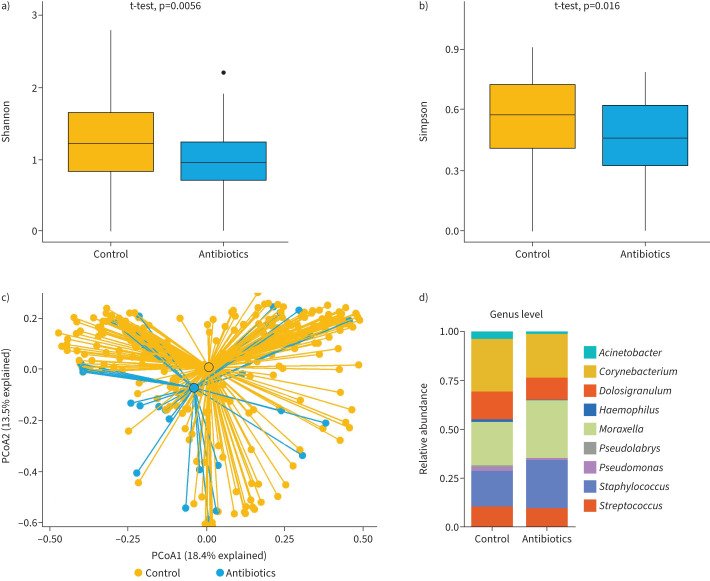
FIGURE 3.
Comparison of different microbiome metrics between infants with and without antibiotic exposure in third trimester: α-diversity represented by a) Shannon and b) Simpson (p-values were obtained using t-test); c) β-diversity: principal coordinate analysis (PcoA) based on Bray distance permutational multivariate ANOVA p=0.120; d) relative abundance of the most frequent genera.

