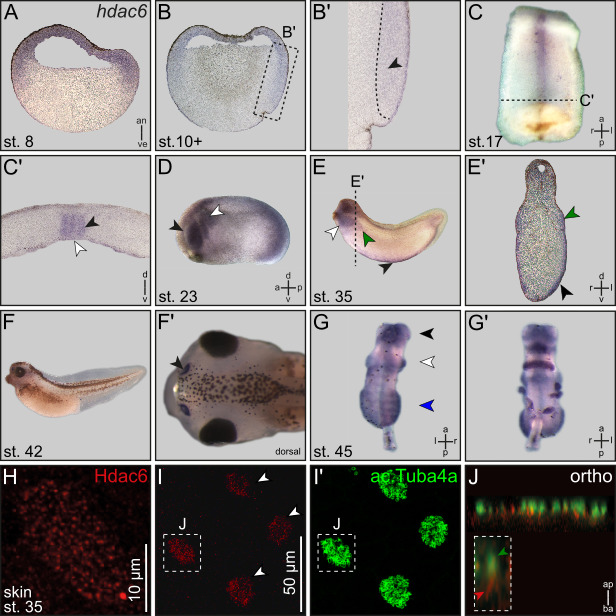
Figure 1. Expression of Xenopus hdac6 on mRNA and protein level .

(A) Sagital section of a blastula stage Xenopus embryo. hdac6 is ubiquitously expressed in cells that form the animal hemisphere of the frog embryo. (B) Sagittal section of a gastrula embryo. hdac6 signal is detectable in the ectoderm, cells of the superficial mesoderm and cells of mesodermal fate (black arrow head in magnification B’). (C) Ventral view of a dorsal explant of a neurula embryo. (C’) Transversal section of C. hdac6 expression is restricted to the notochord and cells of the gastrocoel roof plate i.e. the LRO (black and white arrow head, respectively). (D) hdac6 is expressed in the developing eye cup (black arrow head) and in migrating neural crest cells (white arrow head). (E) hdac6 transcripts appear in the pronephric kidney (green arrow head), ventral hematopoietic stem cells (black arrow head) and in the developing craniofacial cartilage (white arrow head). (E’) transversal section of E. (F) hdac6 activity in larval nasal pits. (F’) Dorsal view of tadpole shown in F. Nasal pit is highlighted (black arrow head). (G) Dorsal view of pre-metamorphic brain explant. hdac6 shows a regionalized expression pattern in the tel-, di- and rhombencephalon (black, white or blue arrowheads, respectively). (G’) Ventral view of the brain explant shown in G’. (H) Immunofluorescent staining of Hdac6 (red) in the larval epidermis at stage 35. Hdac6 shows a spotted expression pattern within epidermal cells. Staining of acetylated alpha-Tubulin (ac.Tuba4a) by immunofluorescence (green) reveal that Hdac6 positive cells are multiciliated cells (MCCs). J in I and I’ indicates MCC shown in J. (J) Orthogonal section of a MCC stained against Hdac6 (red) and ac.Tuba4a (green). Hdac6 localizes at the base of motile cilia. Inserted box shows a magnification of a single cilium. The ciliary axonem is highlighted by a green arrow head, Hdac6 localization is indicated by a red arrow head.
Scale bar: 10µm (I) Hdac6 is detected in a distinct subtype of epidermal cells (white arrowheads) Scale bar: 50µm. (I’)
