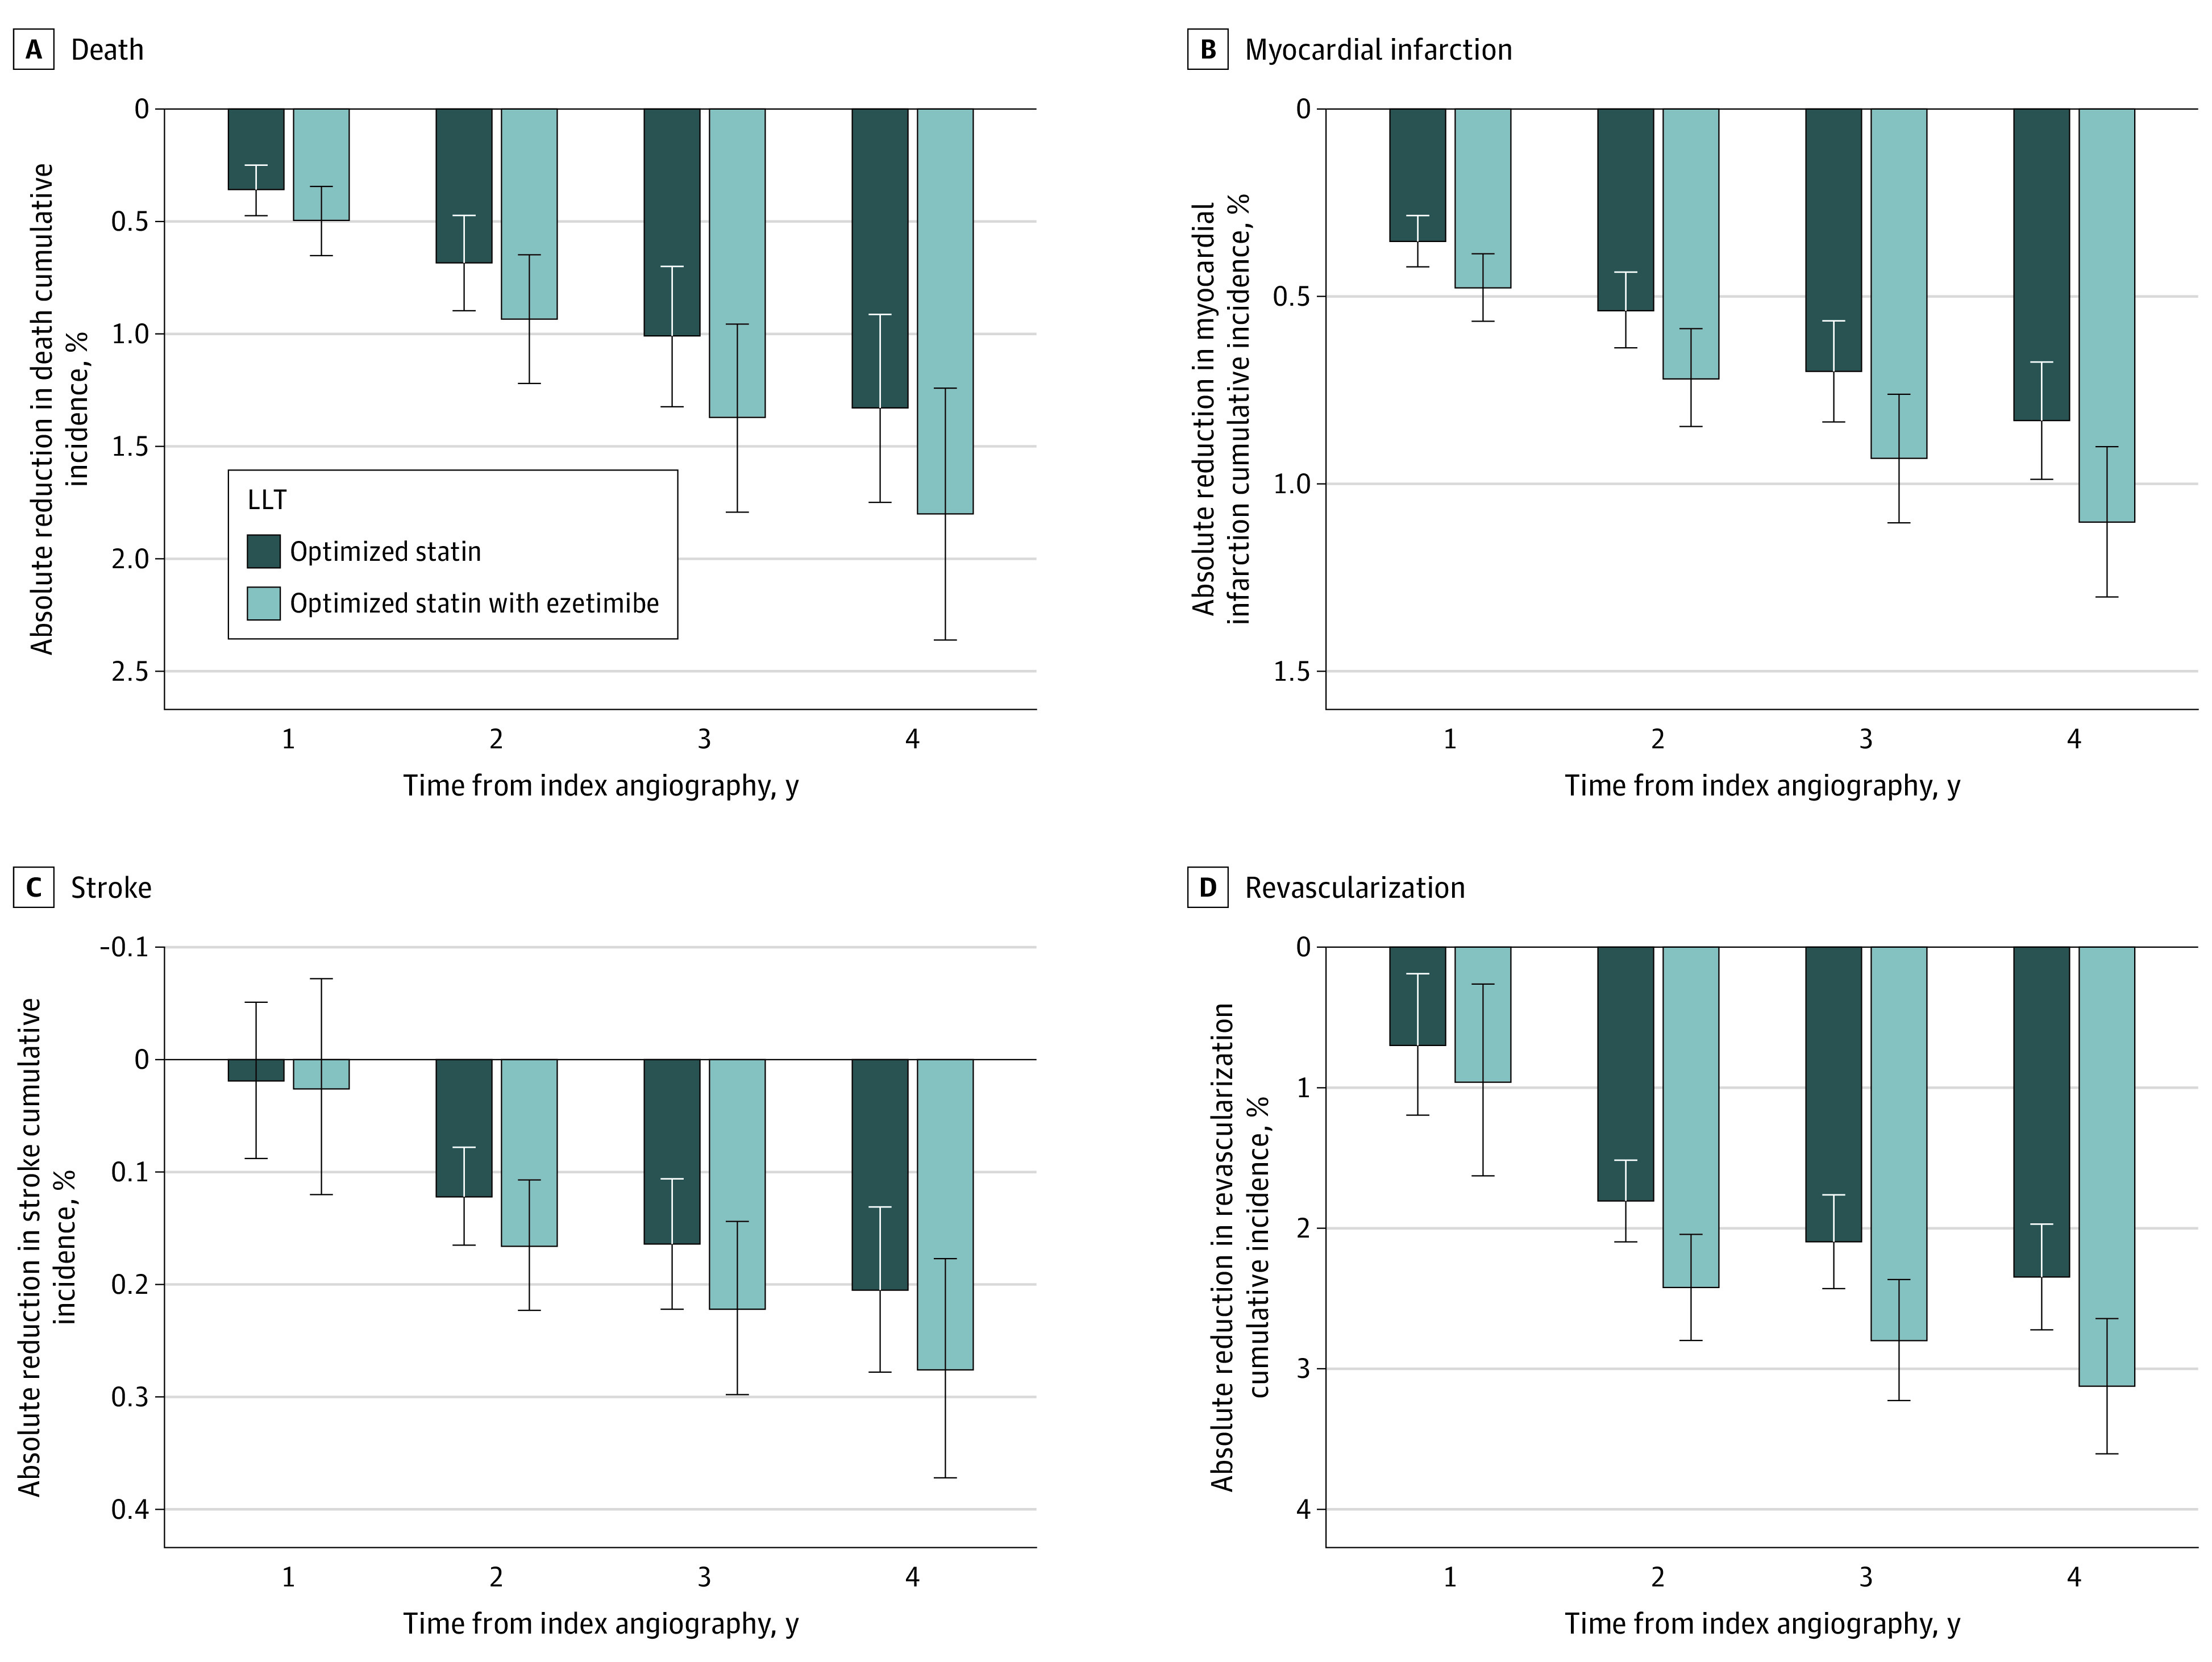
Figure 3. Projected Absolute Reduction in Cumulative Incidence of Adverse Outcomes with Optimized Lipid-Lowering Therapy (LLT).

The projected percentage of risk reduction is presented for the cumulative incidences of the following 4 subcategories of adverse events: A, death; B, myocardial infarction; C, stroke; and D, coronary revascularization. The error bars represent 95% CIs. The values were projected for optimized statin therapy alone and for optimized statin therapy with ezetimibe.
