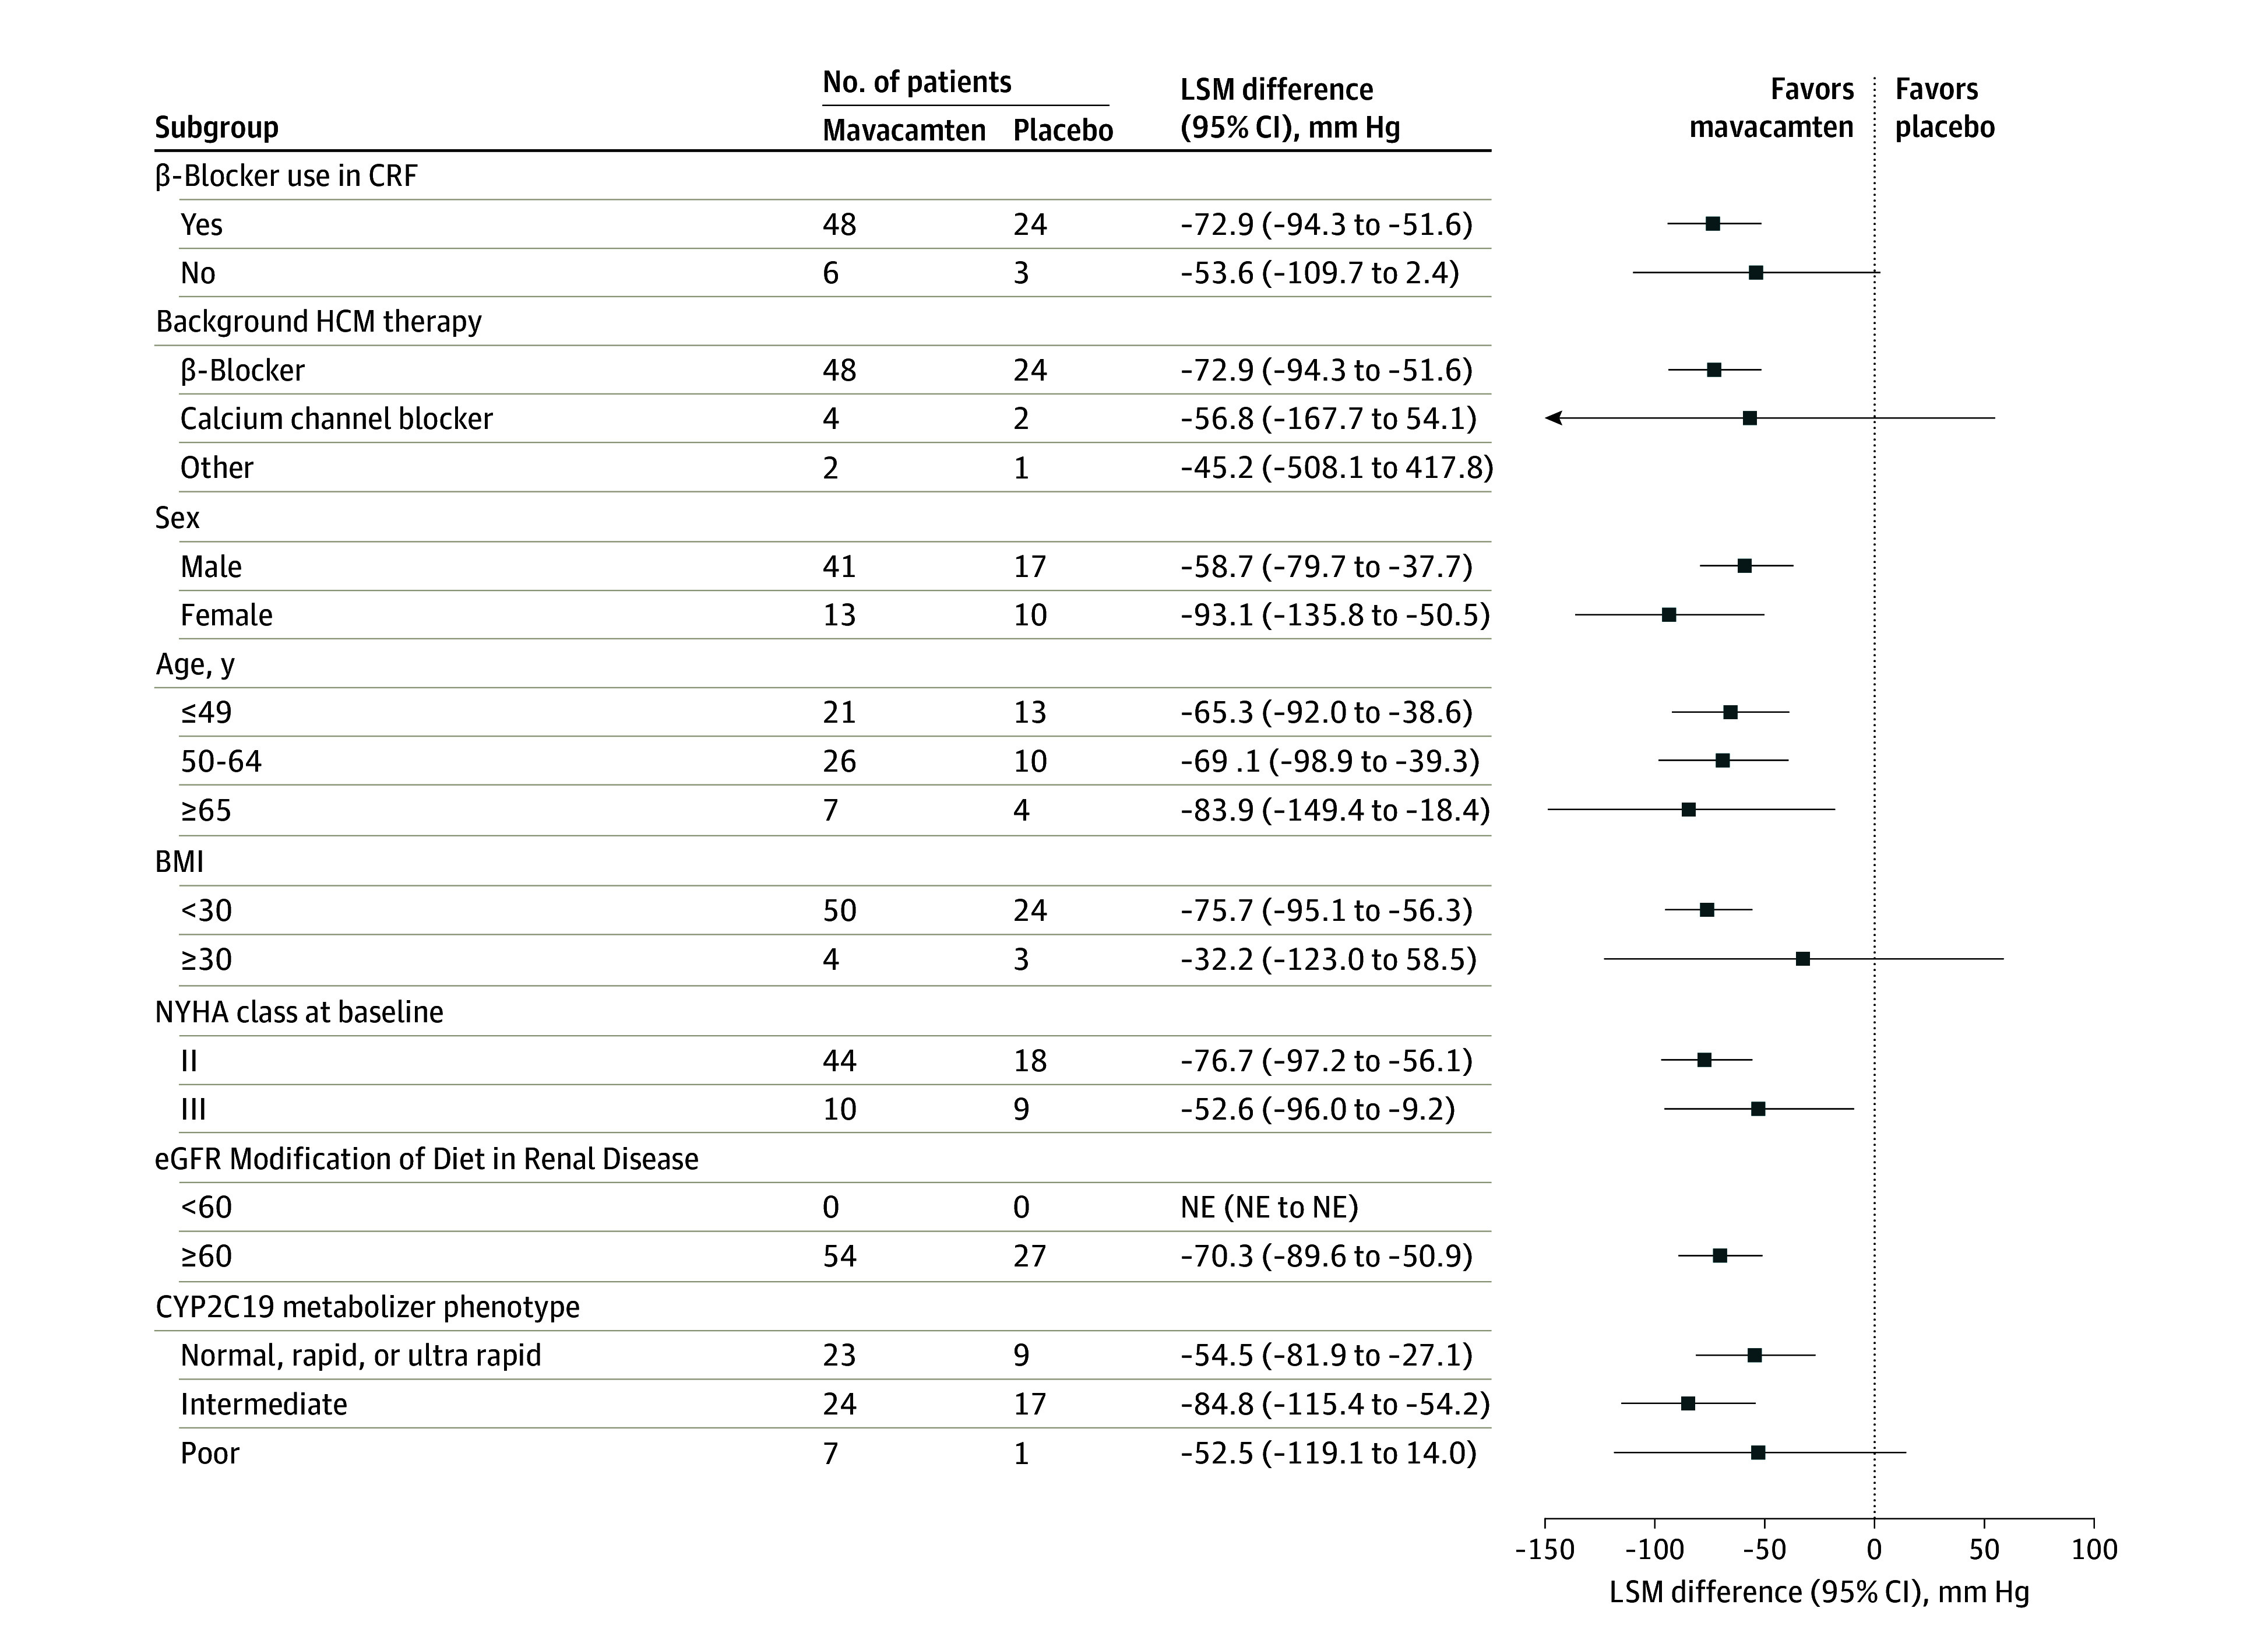
Figure 3. Forest Plot of Change in Valsalva Left Ventricular Outflow Tract (LVOT) Peak Gradient Across Subgroups From Baseline to Week 30.

Abbreviations: BMI, body mass index (calculated as weight in kilograms divided by height in meters squared); CRF, case report form; eGFR, estimated glomerular filtration rate; HCM, hypertrophic cardiomyopathy; LSM, least-squares mean; NE, not estimable; and NYHA, New York Heart Association.
