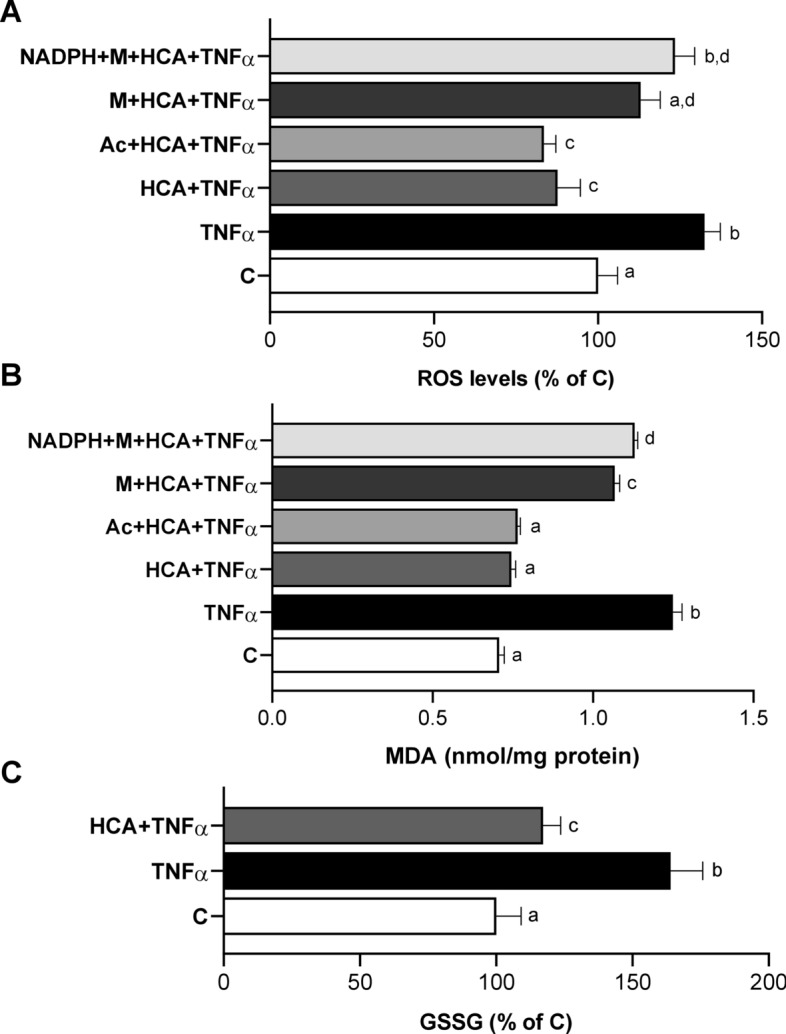
Fig. 2.

Effect of ACLY inhibition by HCA on ROS, lipid peroxidation and GSSG. HH cells were treated with 5 ng/mL TNFα in the absence (TNFα) or in the presence of 500 μM HCA (TNFα + HCA). Unstimulated cells (C) were used as a negative control. In A, B TNFα + HCA cells were cotreated with 5 mM sodium acetate (Ac) or 5 mM sodium malate (M) alone or in combination with 500 μM NADPH for 24 h and ROS (A) and MDA (B) levels were measured. In C GSSG levels are shown. Mean values ± SD of three independent experiments with at least three replicates in each are shown. In A and C values are expressed as the percentage of unstimulated cells (C, set at 100%). Statistical significance of differences was evaluated by using one-way ANOVA followed by Tukey’s multiple comparison test. Different letters indicate significant differences between treatments at p < 0.05
