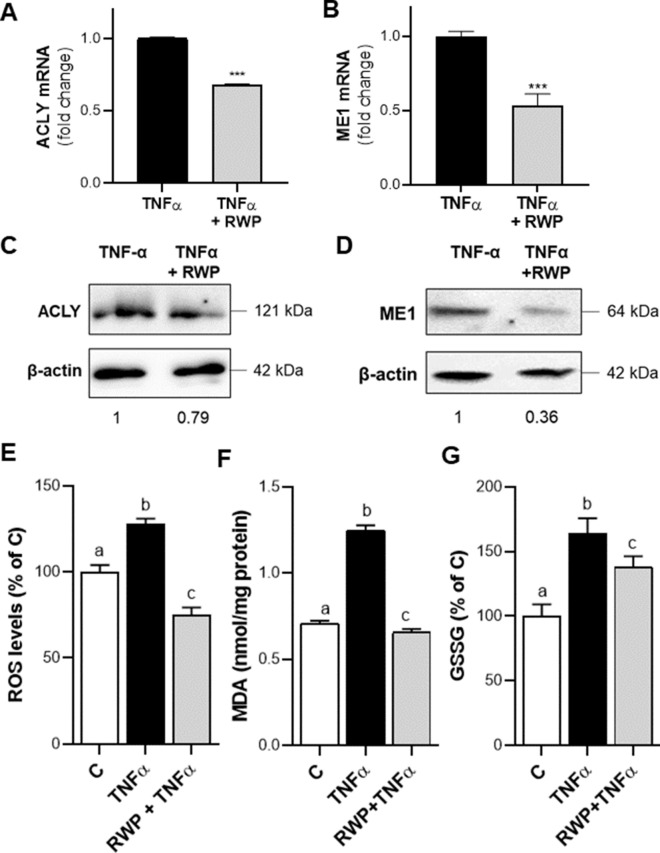
Fig. 3.
Effect of RWP on ACLY and ME1 expression and on oxidative stress. HH were triggered by 5 ng/mL TNFα in the absence (TNFα) or in the presence of 200 μg/mL RWP (TNFα + RWP). Via real time PCR analyses ACLY (A) and ME1 (B) mRNA fold changes were quantified. Western blot analyses were performed to measure ACLY (C) and ME1 (D) protein levels. Values obtained after normalization to β-actin are reported under western blot images. Protein expression levels in untreated HH (C) were taken as 1, and other samples were expressed in proportion to the control. Immunoblot data are representative of at least 3 independent experiments. In E–G ROS, lipid peroxidation and GSSG were evaluated following 24 h treatment with TNFα. Unstimulated cells (C) were used as a negative control. In E and G values are expressed as the percentage of unstimulated cells (C, set at 100%). In A, B, E–G mean values ± SD of three independent experiments with at least three replicates in each are shown. In A, B differences were significant according to Student’s t-test (***p < 0.001). In E–G statistical analysis was performed by using one-way ANOVA followed by Tukey’s multiple comparison test. Distinct letters indicate significant differences between treatments at p < 0.05

