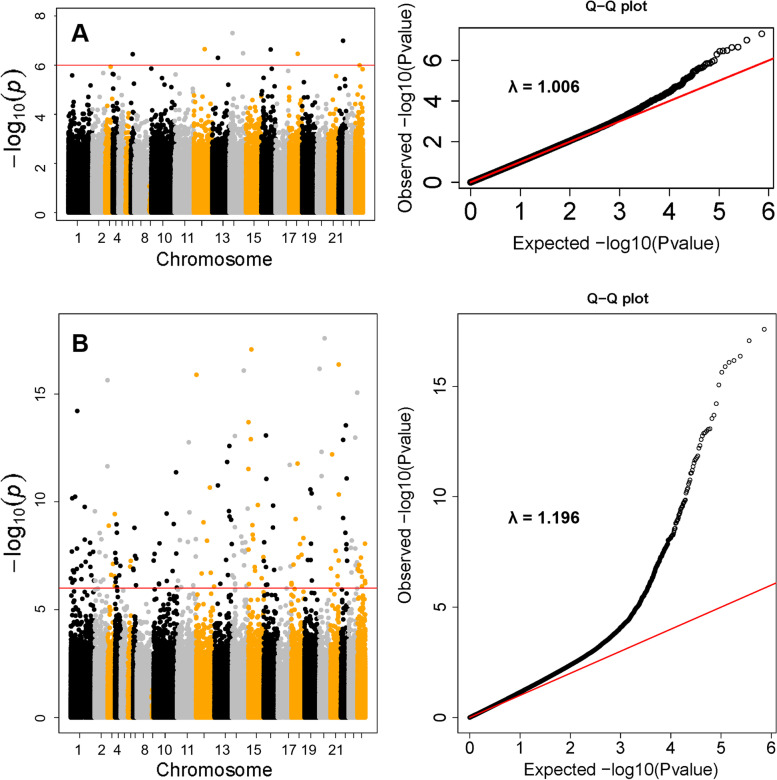
Fig. 2.
Manhattan plot and Q.Q. plot of the P values of the associations between maternal body mass index (BMI) (A), maternal BMI and maternal BMI x maternal smoking (B) and each cytosine-phosphoguanine (CpG) site. A The associations without accounting for maternal BMI x maternal smoking interaction on DNAm. B The associations accounting for maternal BMI x maternal smoking interaction on DNAm. We performed likelihood ratio test (2-df LRT) comparing model 1 (with maternal BMI and the cross-product term of maternal BMI x smoking) to model 2 (without these two terms). In the Manhattan plot, the red line represents − log10 P at false discovery rate (FDR) = 0.05

