Fig. 2.
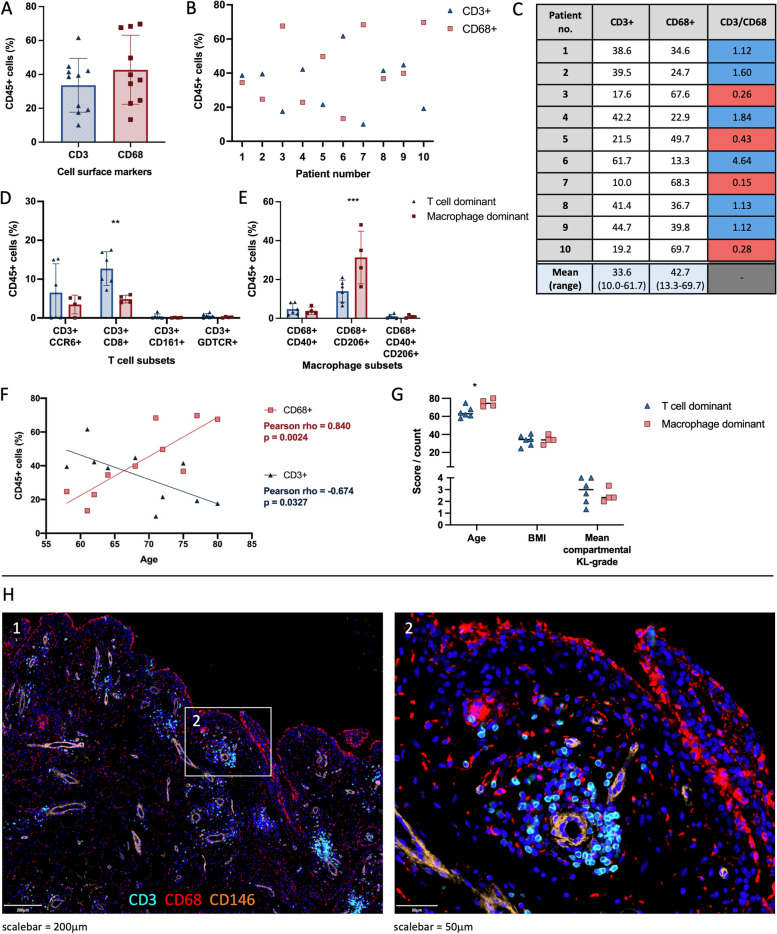
The relative frequency (%) and localisation of macrophages (CD68+) and T cells (CD3+) cells in advanced OA synovium as a percentage of immune cells (CD45+). A–C Flow cytometry was used to reveal the relative frequencies (%) of macrophages and T cells. D–E The differences in relative frequency (%) of T cell subsets (D) and macrophage subsets (E) between T cell dominant (blue) or macrophage dominant (red) patients. F Relationship between the relative frequency (%) of macrophages and T cells and the age of the patient. G The differences in age, BMI, and mean compartmental Kellgren-Lawrence (KL) grade between T cell dominant (blue) or macrophage dominant (red) patients. n=10. H Representative immunofluorescence staining of T cells (CD3, cyan) and macrophages (CD68, red); DAPI staining (blue) was used to visualise nuclei and CD146 (orange) to visualise vessels

