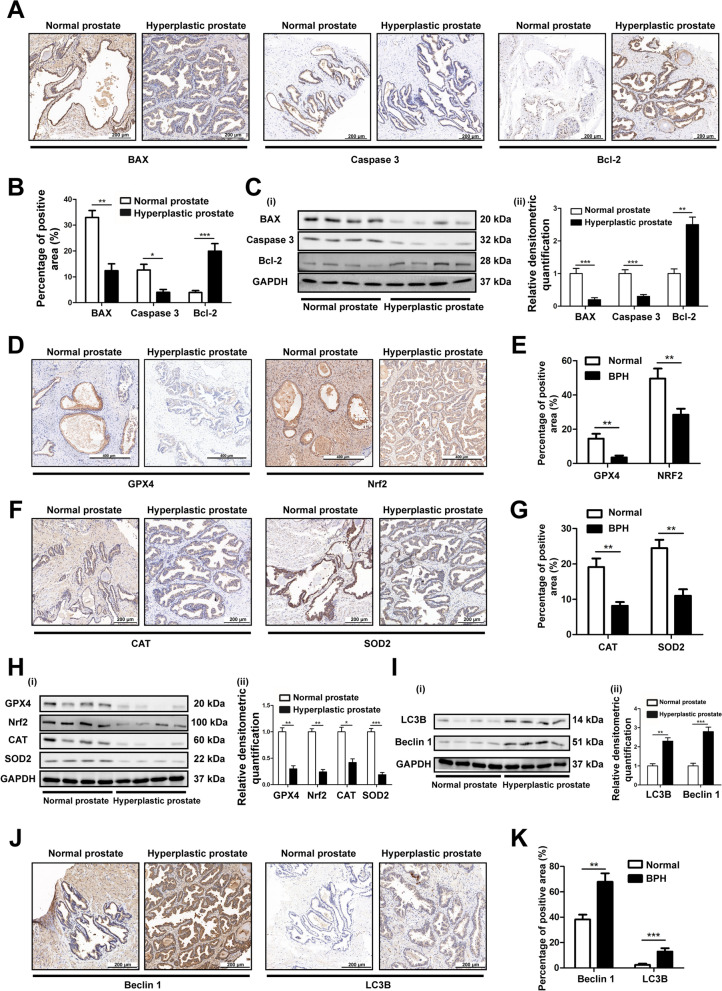
Fig. 9.
The levels of apoptosis, OS, ferroptosis and autophagy in normal and hyperplastic prostates A Representative IHC images of BAX, Caspase 3 and Bcl-2 in human prostate tissues. The scale bars are 200 μm. B The quantitative analysis of BAX, Caspase 3 and Bcl-2 expression in human prostate tissues. C Immunoblot assay (i) and relative densitometric quantification (ii) revealed the protein expression of BAX, Caspase 3 and Bcl-2 in normal prostate tissues (n = 4) and BPH tissues (n = 4). The results showed that there was a lower level of apoptosis in human hyperplastic prostate. D Representative IHC images of GPX4 and Nrf2 in human prostate tissues. The scale bars are 400 μm. E The quantitative analysis of GPX4 and Nrf2 expression in human prostate tissues. F Representative IHC images of CAT and SOD2 in human prostate tissues. The scale bars are 200 μm. G The quantitative analysis of CAT and SOD2 expression in human prostate tissues. H Immunoblot assay (i) and relative densitometric quantification (ii) revealed the protein expression of GPX4, Nrf2, CAT and SOD2 in normal prostate tissues (n = 4) and BPH tissues (n = 4). The results showed that there were higher levels of ferroptosis and OS in human hyperplastic prostate. I Immunoblot assay (i) and relative densitometric quantification (ii) revealed the protein expression of LC3B and Beclin1 in normal prostate tissues (n = 4) and BPH tissues (n = 4). J Representative IHC images of Beclin1 and LC3B in human prostate tissues. The scale bars are 200 μm. K The quantitative analysis of Beclin1 and LC3B expression in human prostate tissues. The results showed that there was a higher level of autophagy in human hyperplastic prostate. GAPDH is used as loading control. *p < 0.05, **p < 0.01, ***p < 0.001

