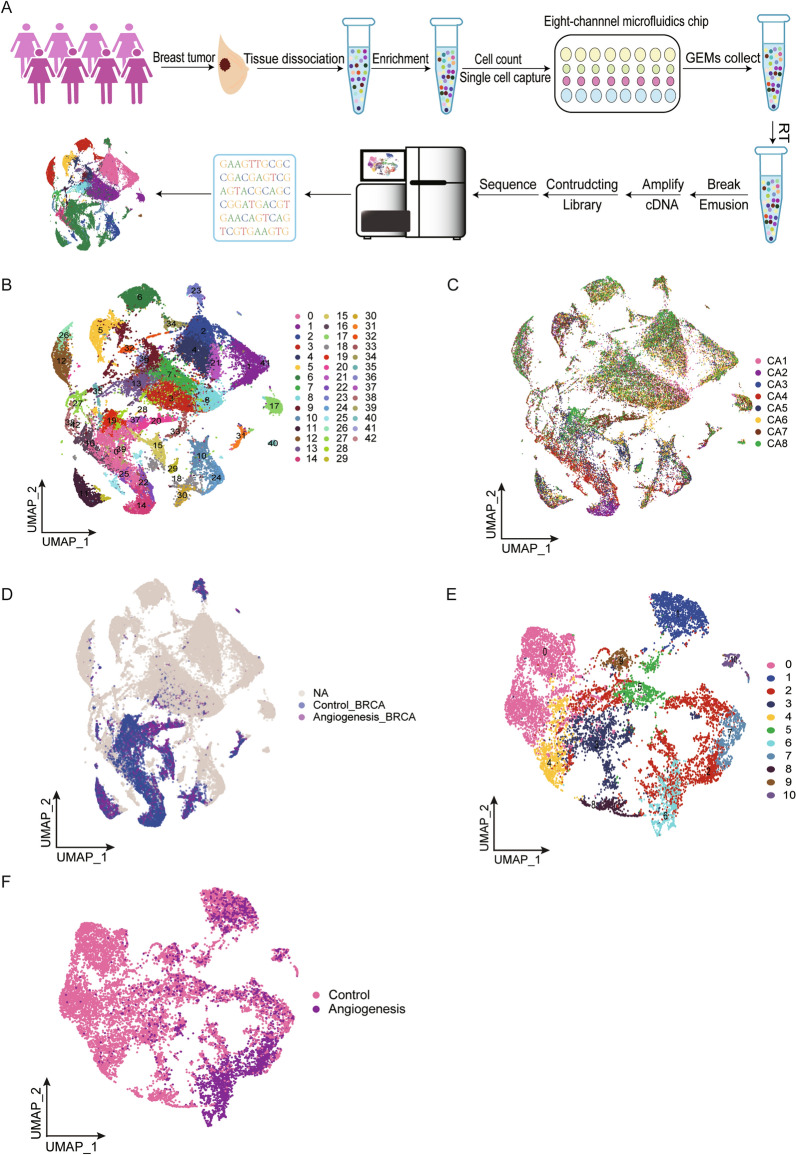
Fig. 1.
Single-cell transcriptomic profiles of breast cancers with and without angiogenesis. A Workflow illustrating sample preparation, sequencing and bioinformatic analysis. B UMAP plot colored by inferred cell clusters. C UMAP of 48,644 cells from eight breast cancer tissues. D The distribution of malignant cells in different tumors with and without angiogenesis. Malignant cells with or without angiogenesis were classified as angiogenesis and control groups, respectively. The rest of the cells were classified in the NA group. E Single-cell map showing subclusters of malignant cells. F Single-cell atlas showing tumor cell subsets of angiogenic and non-angiogenic breast cancer groups

