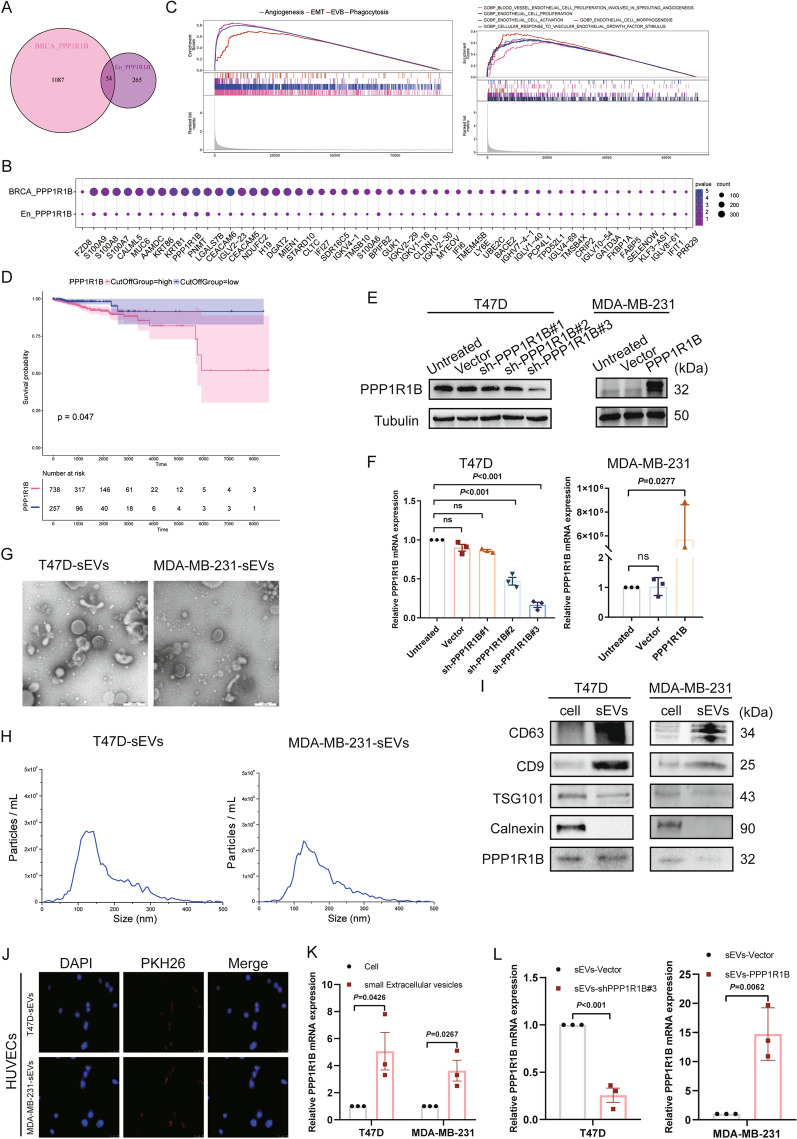
Fig. 6.
Single-cell atlas demonstrates shows association between specific endothelial and malignant cell subclusters in angiogenic breast cancer. A Venn diagram showing overlapping genes between BRCA_PPP1R1B and En_PPP1R1B. B Expression levels of common marker genes. C Gene set enrichment analysis (GSEA) showing the main pathways enriched in BRCA_PPP1R1B and En_PPP1R1B. D Effects of PPP1R1B expression on the overall survival of breast cancer patients. E Western blot analysis of PPP1R1B expression. F qRT-PCR analysis of PPP1R1B knockdown and overexpression efficiency. G Transmission electron microscope images of sEVs from T47D and MDA-MB-231 cells. Scale bar, 200 nm. H NTA showing the distribution of the size and concentration of isolated exosomes. I Western blot analysis of the expression levels of CD63, CD9, TSG101 (exosome marker genes) and calnexin (negative control) in sEVs and lysates from T47D and MDA-MB-231 cells. J Fluorescence microscope images showing the uptake of PKH26-labeled sEVs in HUVECs. Scale bar, 50 µm. K Relative expression of PPP1R1B in cells and sEVs. L Relative expression of PPP1R1B in T47D-sEVs and MDA-MB-231-sEVs after PPP1R1B knockdown and overexpression. Data were the means ± SD of three experiments. Statistical significance was determined by a two-tailed unpaired t-test (K, L)

