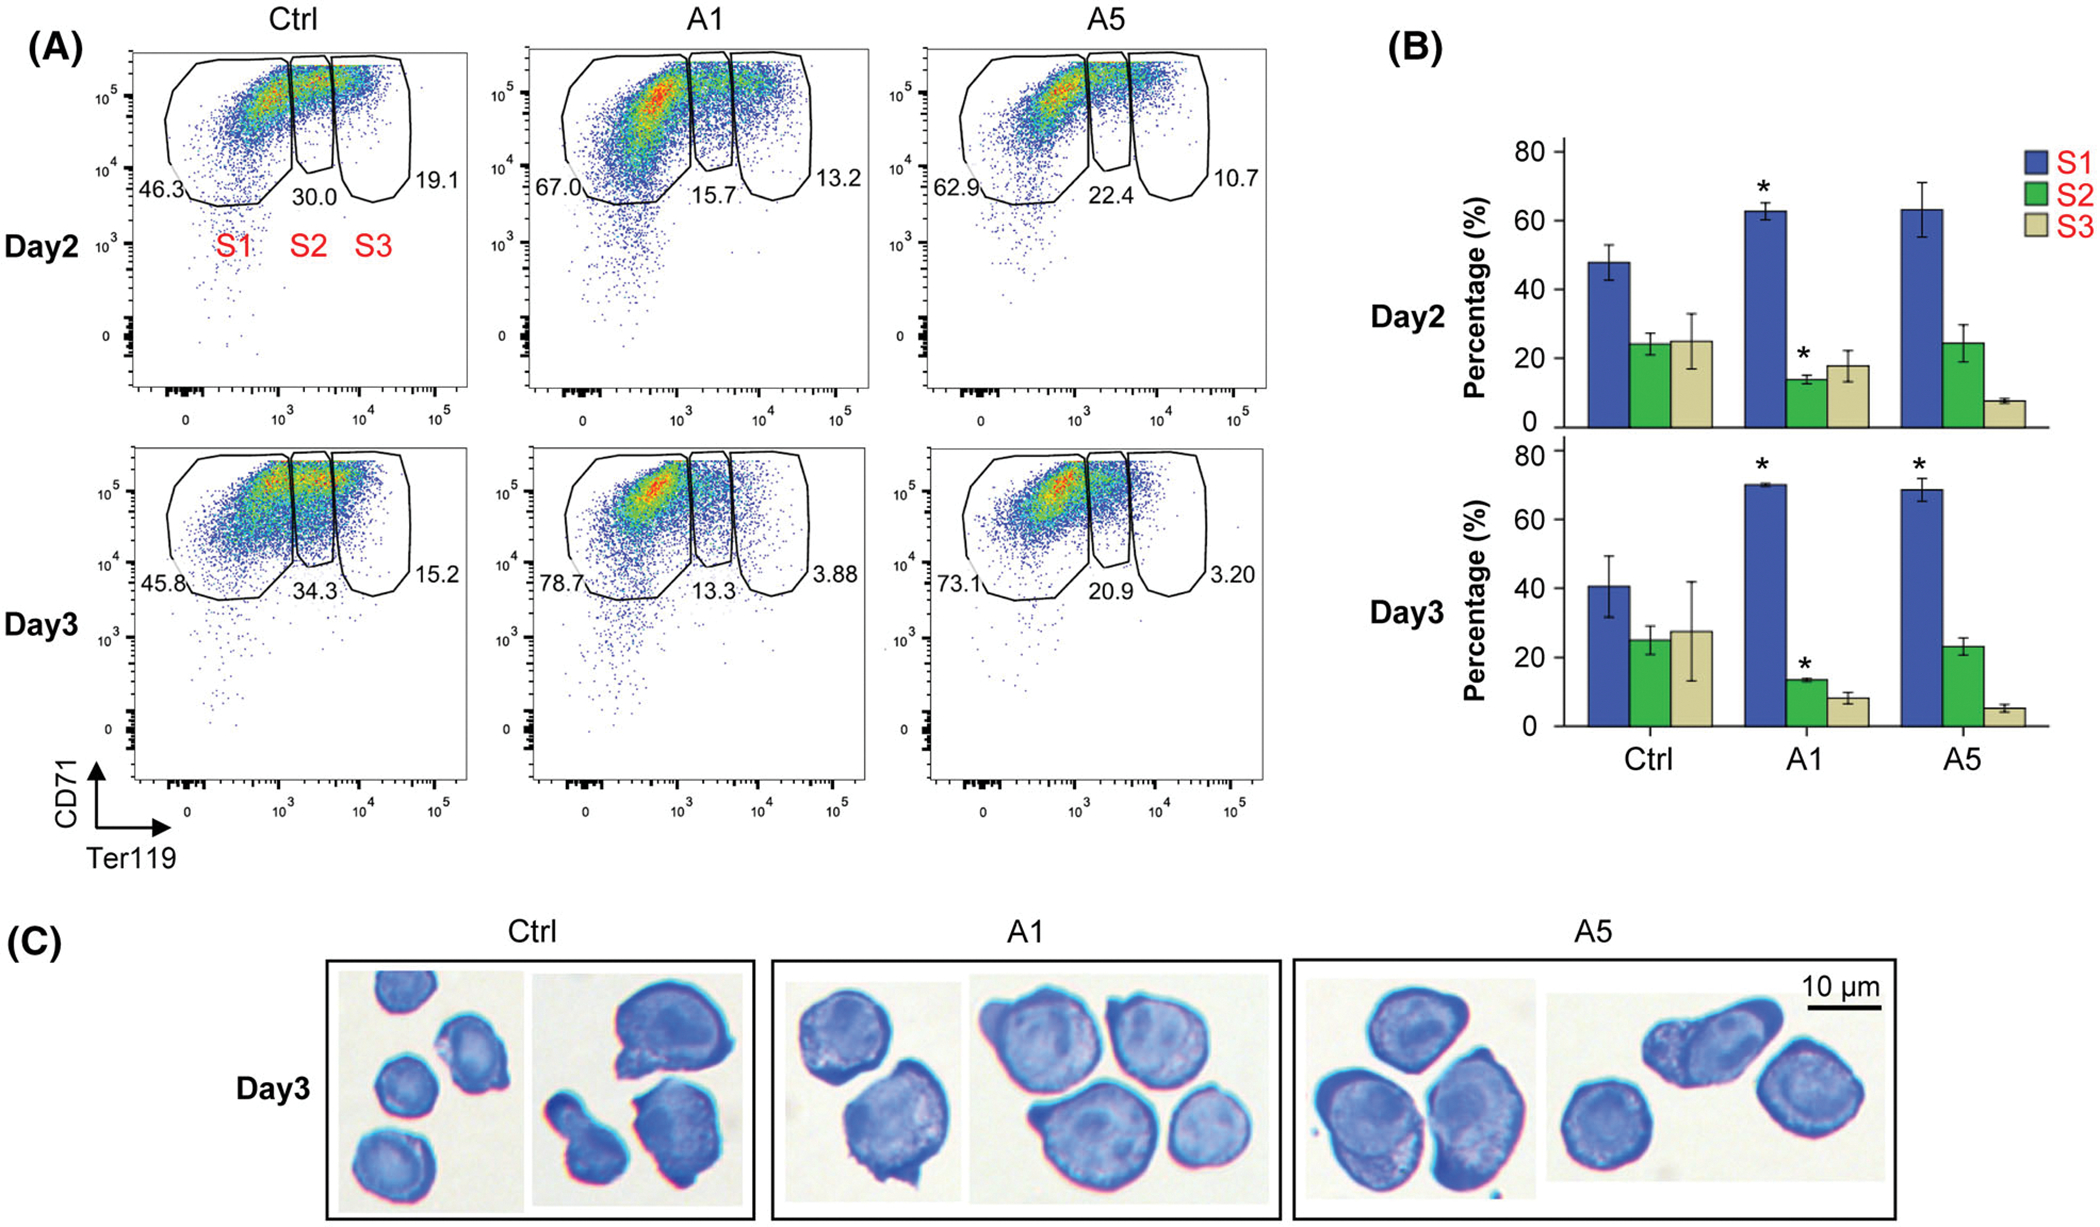
Fig 2.

Differentiation of FL erythroid progenitors upon Atf5 knockdown. (A) Representative flow cytometric plots of cell differentiation and (B) the percentages of cells at different erythroid differentiation stages for the GFP+ cells on days 2 (upper panels) and 3 (bottom panels) (n = 3). Data are presented as mean ± SE. *P < 005 as compared to Ctrl. (C) Representative images of cell morphology on day 3. Scale bar = 10 μm. Ctrl: infected with retrovirus expressing non-targeting shRNA; A1 and A5: infected with retroviruses expressing A1 and A5 shRNAs targeting Atf5 mRNA. Data are presented as mean ± SE. *P < 005 as compared to Ctrl.
