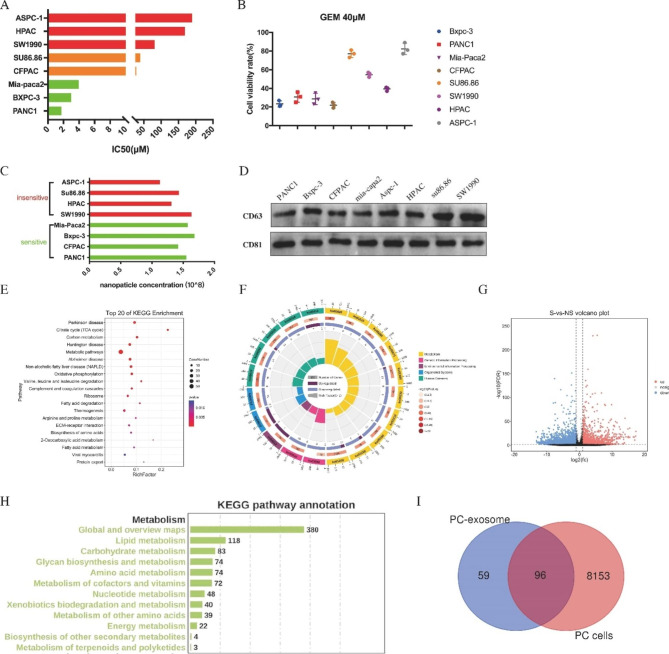
Fig. 1.
Distinct exosomal gene expression profiles in pancreatic cancer cells with different sensitivity [17]. (A) Median inhibitory dose of gemcitabine in different PC cells (IC50). (B) Cell viability of PC cells under 40 μm of gemcitabine. (C) Nanoparticle concentration of exosomes from pancreatic cancer cells detected by NTA. (D) The total amount of exosomes in pancreatic cancer cells was detected by WB. (E and F) KEGG pathway analysis of mass spectrometry results of exosomes proteins between sensitive and insensitive PC cells. (G) The volcano map reflects genes difference between sensitive and insensitive pancreatic cancer cells. (H) KEGG pathway analysis of RNA-seq results between sensitive and insensitive PC cells. (I) Wayne diagram shows the intersection of differential molecules of PC-derived exosomes and PC cells

