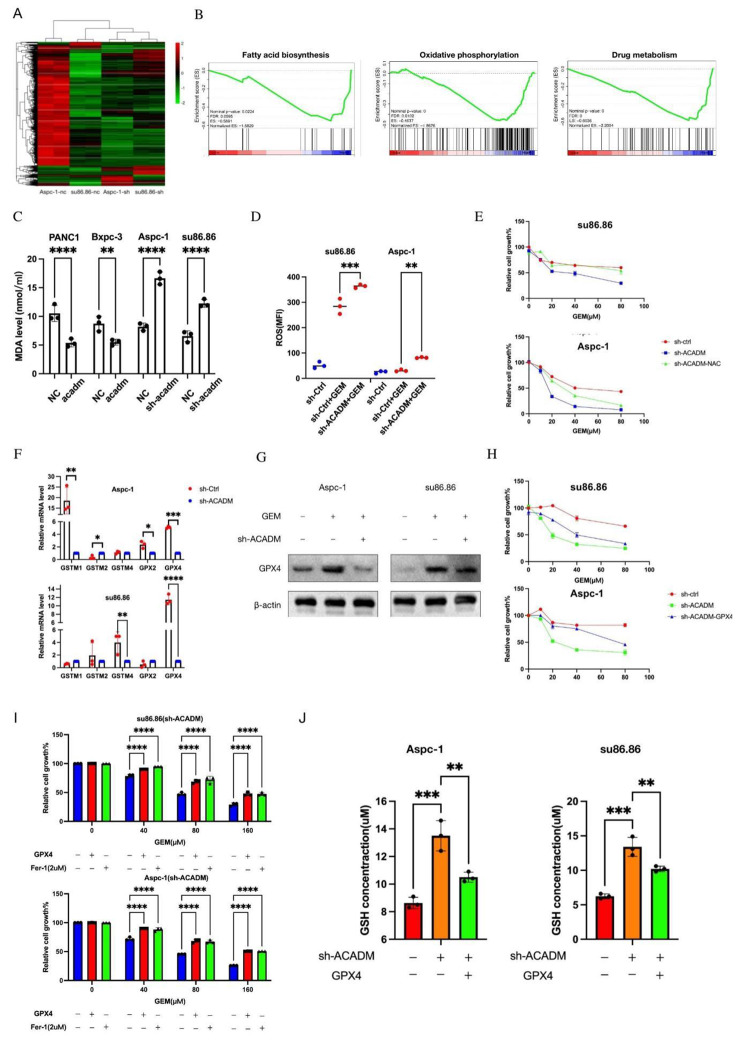
Fig. 6.
ACADM knockdown enhanced the FA-triggered cytotoxic effects of gemcitabine by inducing ferroptosis (A) Heatmap of differential genes after knockdown of ACADM. (B) Gene set enrichment analysis of drug metabolism, oxidative phosphorylation, and fatty acid biosynthesis-related genes in ACADM knockdown cell vs. the control group. (C) Fatty acid peroxisome level of PC cells after ACADM knockdown or overexpression under gemcitabine treatment. (D) ROS level and mean fluorescence intensity (MFI) of pancreatic cancer cells. (E) Cell viability of PC cells after treated with or without NAC or knockdown of ACADM. (F) The level of glutamine metabolism signature expression was detected in sh-control and sh-ACADM cells by qPCR. (G) The GPX4 level of each PC cells were detected by WB. (H) Cell viability of PC cells after ACADM knockdown and GPX4 overexpression. (I) Cell viability of PC cells in different GEM concentration after treated with Fer-1 or GPX4 overexpression. (J) The concentration of glutathione (GSH) was assayed

