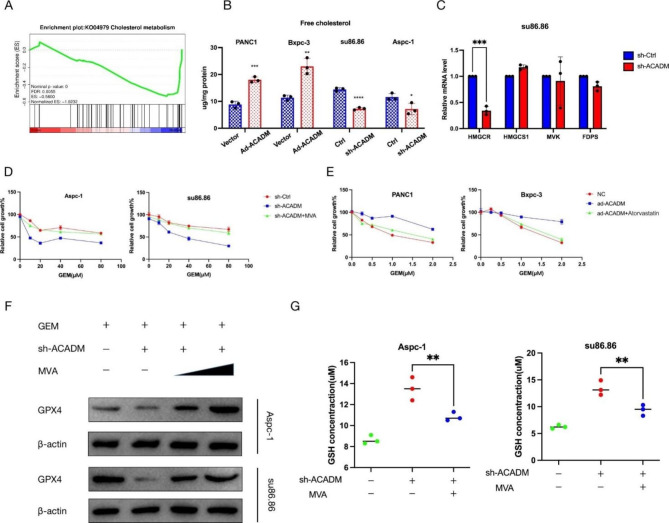
Fig. 7.
ACADM upregulated GPX4 via mevalonate pathway. (A) Gene set enrichment analysis of cholesterol metabolism-related genes in ACADM knockdown cell vs. the control group. (B) Free cholesterol level of each PC cells after ACADM knockdown of overexpression. (C) The level of MVA-signature expression was detected in sh-control and sh-ACADM cells by qPCR. (D) Cell viability of PC cells in three group (GEM + sh-Ctrl,GEM + sh-ACADM, GEM + sh-ACADM + MVA). (E) Cell viability of PC cells in three group (GEM + ad-Ctrl,GEM + ad-ACADM, GEM + ad-ACADM + Atorvastatin). (F) The GPX4 level of each PC cells were detected by WB. (G) The concentration of glutathione (GSH) was assayed

