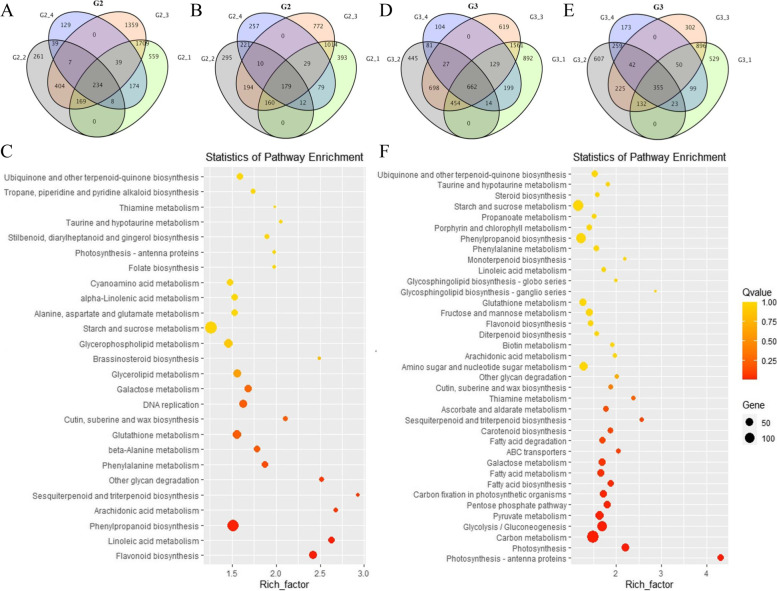
Fig. 2.
RNA-seq analysis of the oil content accumulation and grain formation between wild and cultivated soybeans at the stage of 20 and 30 DAF. A The venn of up-regulated DEGs in G2. B The venn of down-regulated DEGs in G2. C KEGG enrichment analysis of G2. D The venn of up-regulated DEGs in G3. E The venn of down-regulated DEGs in G3. F KEGG enrichment analysis of G3. The abscissa is the rich factor, and the ordinate is the KEGG path name. The greater the rich factor, the more significant the enrichment level of DEGs in this pathway. The color of the circle represents the Q value. The smaller of Q value, the more reliable the enrichment significance of DEGs in this pathway. The size of the circle indicates the number of genes enriched in the pathway

