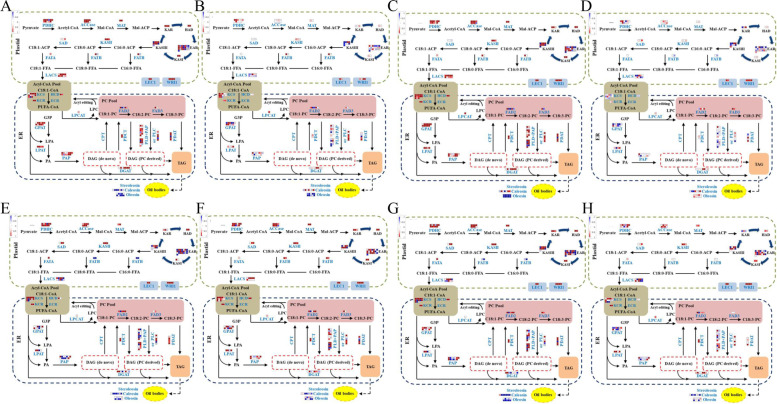
Fig. 3.
The expression of DEGs associated with lipid metabolic pathways in G2 and G3. A-D The expression of DEGs associated with lipid metabolic pathways in G2-1, G2-2, G2-3 and G2-4 between wild and cultivated soybeans at the stage of 20 DAF. E–H The expression of DEGs associated with lipid metabolic pathways in G3-1, G3-2, G3-3 and G3-4 between wild and cultivated soybeans at the stage of 30 DAF. Every square represents a gene in lipid metabolic pathways. The color represents the log2 (FC) of the gene with down-regulation in blue while up-regulation in red

