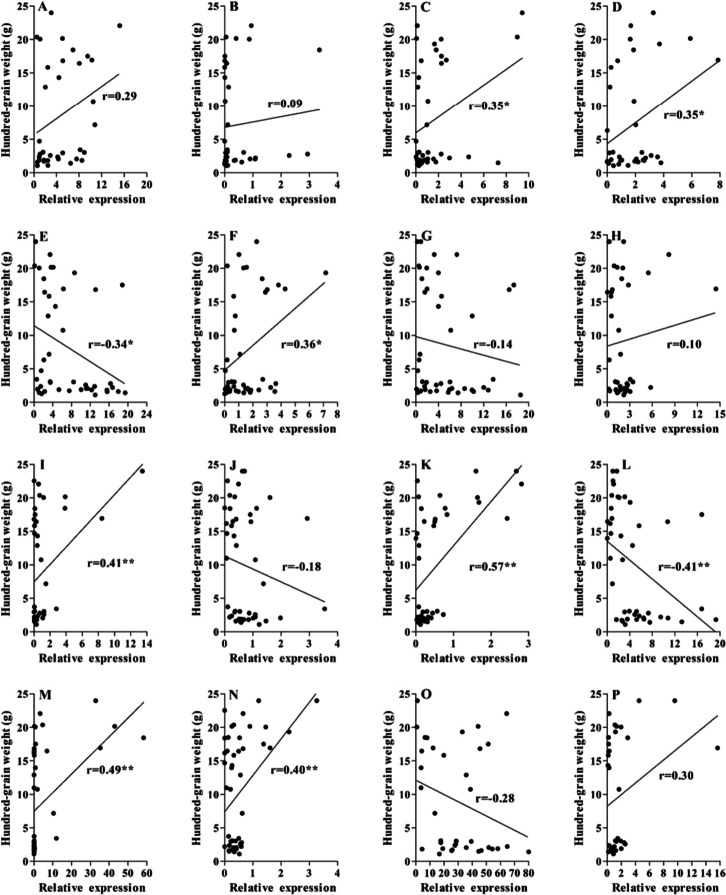
Fig. 8.
Correlation analysis between candidate gene expression level and seed oil content. A-D The correlation between oil content and relative expression level of Glyma.03g189600, Glyma.06g050400, Glyma.06g068800 and Glyma.07g037700; E–H The Glyma.07g069700, Glyma.09g098300, Glyma.09g111900 and Glyma.09g255700; I-L The correlation between oil content and relative expression level of Glyma.10g119900, Glyma.13g253600, Glyma.13g287600 and Glyma.14g123900; M-P The correlation between oil content and relative expression level of Glyma.14g184900, Glyma.17g154500, Glyma.19g164900 and Glyma.20g122000, respectively. The abscissa represents the relative expression level of gene calculated by 2.−ΔΔCT; The ordinate represents seed oil content (%). * represents significance of correlation at P < 0.05; ** represents significance of correlation at P < 0.01

