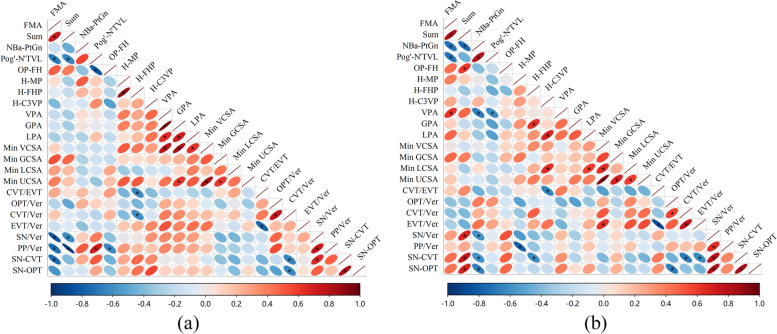
Fig. 3.
Correlation heatmap of craniofacial morphology, upper airway and craniocervical posture in adolescent (a) and adult (b) patients. Positive correlation is represented by red ellipses, while negative correlation is represented by blue ellipses, with a deeper hue indicating a stronger correlation. Specifically, the darker the red, the closer the r is to 1, and the darker the blue, the closer the r is to − 1. Similarly, the ellipse's size also fluctuates as a result of variations in the correlation. The closer the r is to 1 (red) or − 1 (blue), the closer the ellipse is to a line, whereas the closer the r is to 0, the closer the ellipse is to a perfect circle. Correlations with significant differences are highlighted in the figure. (*: p < 0.05; **: p < 0.01;)

