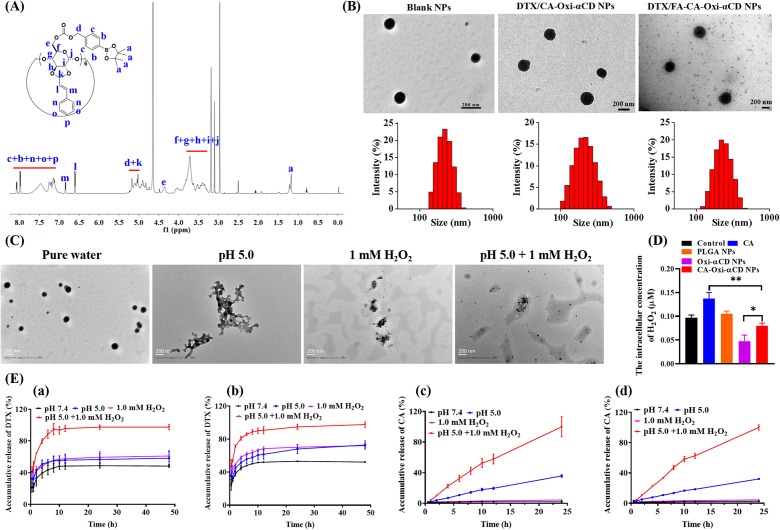
Fig. 2.
1H NMR spectrum of CA-Oxi-αCD carrier and the characterization of DTX/CA-Oxi-αCD NPs and DTX/FA-CA-Oxi-αCD NPs. (A) 1H NMR spectrum of CA-Oxi-αCD carrier. (B) Size distribution and morphology of Blank NPs, DTX/CA-Oxi-αCD NPs and DTX/FA-CA-Oxi-αCD NPs. (C) The change of morphology of DTX/FA-CA-Oxi-αCD NPs in various medium. (D) The intracellular concentration of H2O2 in 4T1 cells after different treatment. The controls were treated with cell culture medium. *p < 0.05, **p < 0.01, compared with CA-Oxi-αCD NPs (n = 3). (E) The in vitro drug release behavior of DTX/CA-Oxi-αCD NPs (a,c) and DTX/FA-CA-Oxi-αCD NPs (b,d) in various release medium for 48 h. (a,b) The released DTX. (c,d) The released CA. Data represent mean ± SD (n = 3)

