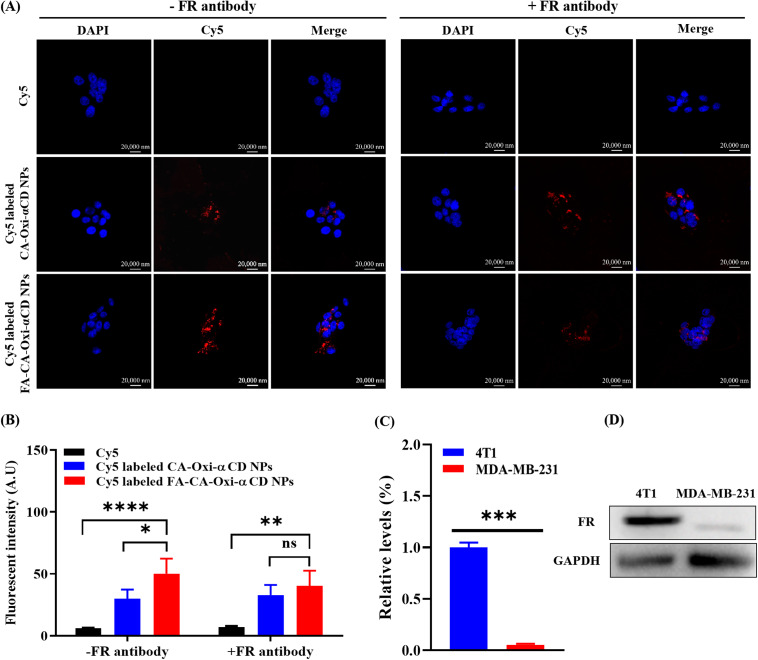
Fig. 3.
The cellular uptake of 4T1 cells treated with Cy5, Cy5-labeled CA-Oxi-αCD NPs and Cy5-labeled FA-CA-Oxi-αCD NPs for 6 h. (A) CLSM images of uptake of 4T1 cells with or without FR pretreatment. DAPI for nuclei staining (blue), Cy5 labeled NPs (red). Scale bar represents 20 μm. (B) The semi-quantitative analysis of the corresponding Cy5 fluorescence intensity of intracellular NPs (red) in 4T1 cells with or without FR pretreatment. (C) Quantitative analysis of FR expression in 4T1 cells and MDA-MB-231 cells. (D) Western blot analysis for the expression of FR in 4T1 cells and MDA-MB-231 cells. *p < 0.05, **p < 0.01, ***p < 0.001, ****p < 0.0001, ns, no significant difference, compared with Cy5-labeled FA-CA-Oxi-αCD NPs (n = 3)

