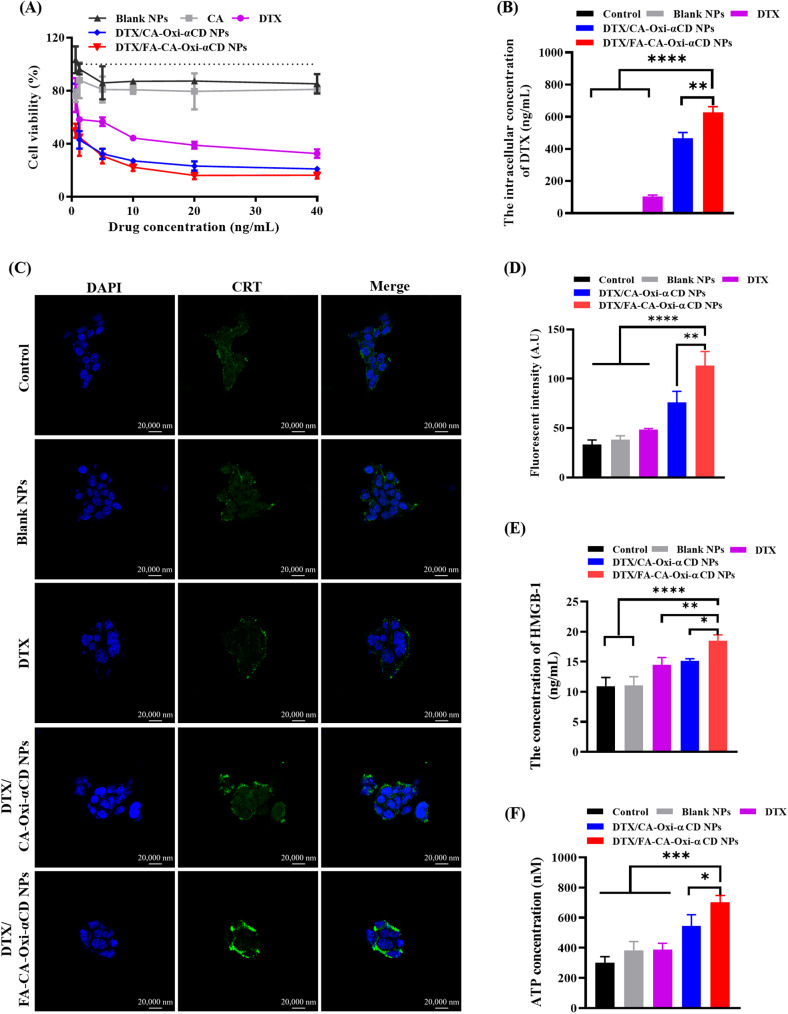
Fig. 5.
The antitumor effects and ICD induction of NPs on 4T1 cells in vitro. (A) Cell viabilities of 4T1 cells after treatment with DTX, CA, Blank NPs, DTX/CA-Oxi-αCD NPs and DTX/FA-CA-Oxi-αCD NPs with various drug concentration for 48 h. (B) The intracellular concentration of DTX in 4T1 cells treated with DTX, Blank NPs, DTX/CA-Oxi-αCD NPs and DTX/FA-CA-Oxi-αCD NPs for 48 h. The controls were treated with cell culture medium. (C) The CLSM images of CRT expression in 4T1 cells after different treatments. Scale bar represents 20 μm. (D) The semi-quantitative analysis of CLSM of the CRT expression in 4T1 cells after different treatments. (E) The quantitative determination of HMGB1 release from 4T1 cells after different treatments with ELISA kit. (F) ATP secretion from 4T1 cells after different treatments. *p < 0.05, **p < 0.01, ***p < 0.001, and ****p < 0.0001, compared with FA-CA-Oxi-αCD NPs (n = 3)

