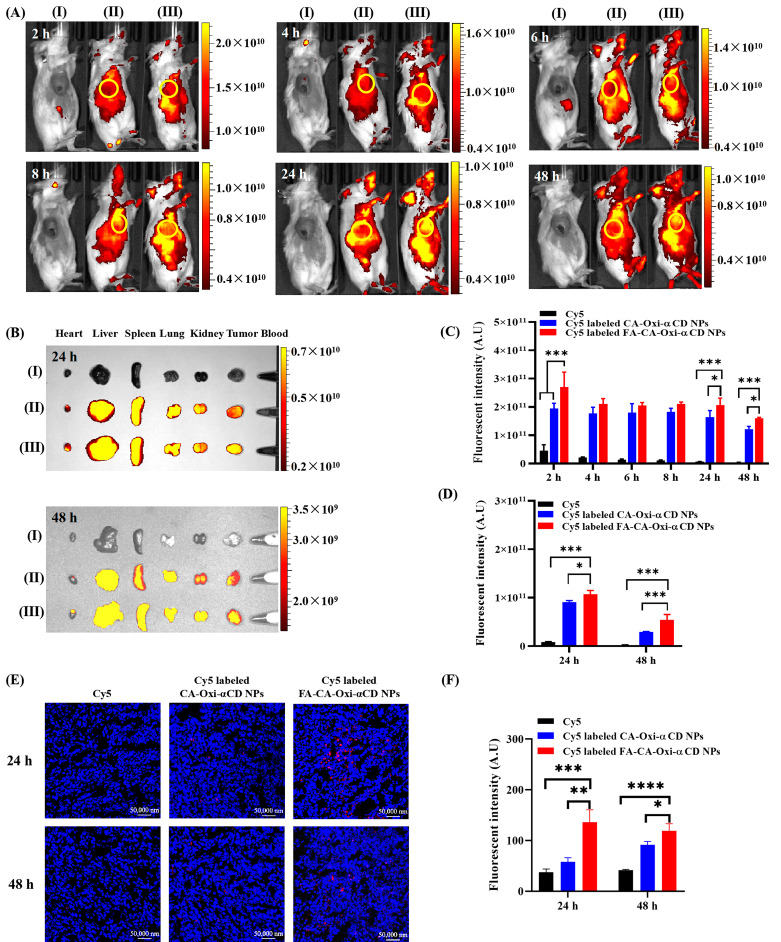
Fig. 6.
In vivo fluorescence distribution of 4T1 tumor-bearing mice after intravenous administration of free Cy5, Cy5-labeled CA-Oxi-αCD NPs and Cy5-labeled FA-CA-Oxi-αCD NPs. (A) In vivo images of mice after 2 h, 4 h, 6 h, 8 h, 24 and 48 h injection. (B) Ex vivo fluorescence image of the excised tumors and major tissues at 24 and 48 h post-injection. (C) Semi-quantitative analysis of fluorescence intensity of mice after 2 h, 4 h, 6 h, 8 h, 24 and 48 h injection in vivo. (D) Semi-quantitative analysis of fluorescence intensity in excised tumor at 24 and 48 h. (E) CLSM images of tumor sections from mice after different treatments. Red, Cy5-labeled NPs, blue, cell nuclei stained with DAPI. Scale bar represents 50 μm. (F) Semi-quantitative analysis of CLSM images of tumor tissues from mice with different treatment at 24 and 48 h. (I) free Cy5, (II) Cy5-labeled CA-Oxi-αCD NPs, (III) Cy5-labeled FA-CA-Oxi-αCD NPs. *p < 0.05, **p < 0.01, ***p < 0.001, ****p < 0.0001, compared with Cy5-labeled FA-CA-Oxi-αCD NPs (n = 3)

