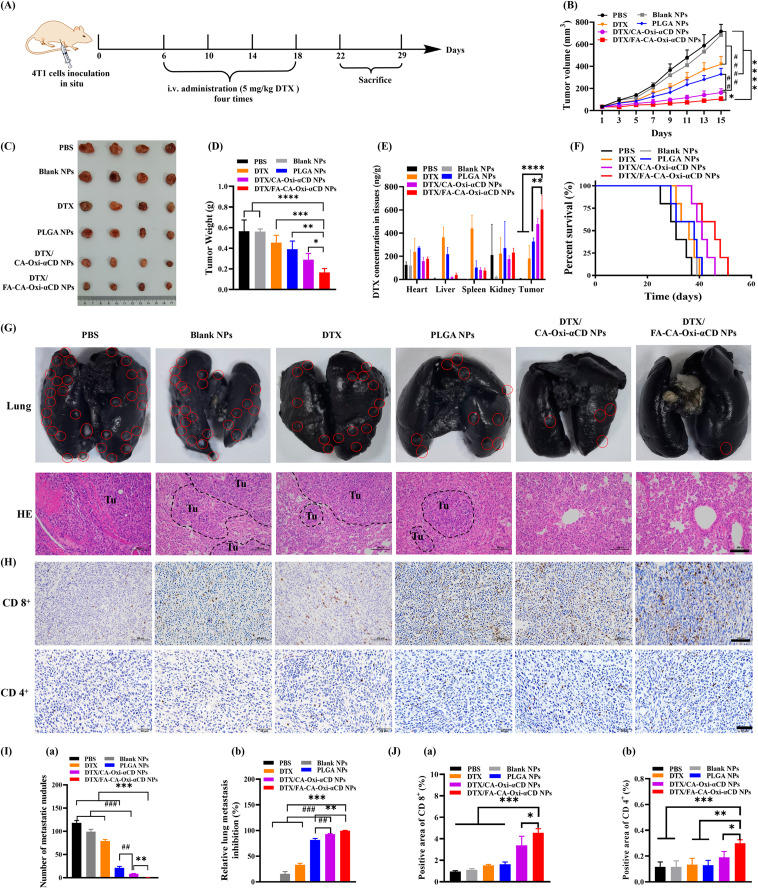
Fig. 7.
In vivo antitumor and antimetastasis efficacy evaluation. (A) Scheme illustration of the in vivo antitumor experiment design. (B) Tumor growth curves after intravenous injection of free DTX and various NPs. (C) Representative photographs of tumor tissue from mice in different groups. (D) The tumor weight of mice in different groups. (E) The DTX concentration in major tissues of different groups. (F) The survival rate of mice after various treatment. (G) Representative images of lung tissues harvested from mice in different groups and histological examination of the pulmonary metastatic foci in different groups by H&E staining. Scale bar represents 100 μm. (H) Immunohistochemistry assay for CD 8+ (upper panel) and CD 4+ ((lower panel) in tumor tissues. Scale bar represents 100 μm or 50 μm, respectively. (I) (a) The number of visually detected metastatic nodules in the lungs of different groups, (b) The inhibition rate on lung metastasis of different groups. (J) (a) The semi-quantitative analysis of the CD8+ expression and (b) CD4+ expression in tumor tissues from mice after different treatments. *p < 0.05, **p < 0.01, ***p < 0.001 and ****p < 0.0001, compared with DTX/FA-CA-Oxi-αCD NPs. #p < 0.05, ##p < 0.01, ###p < 0.001 and ####p < 0.0001, compared with DTX/CA-Oxi-αCD NPs

