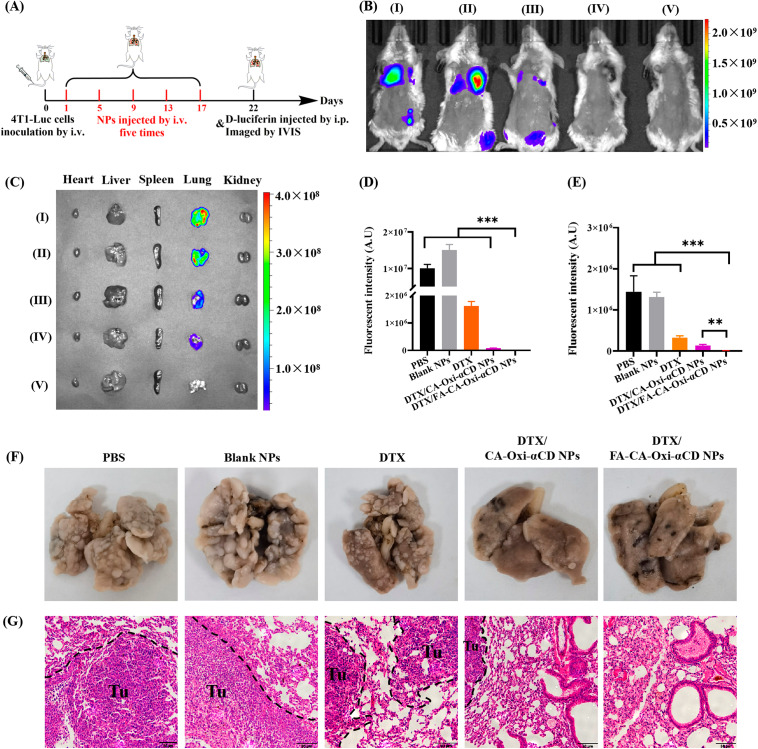
Fig. 8.
In vivo bioluminescent distribution of the mice treated with PBS, Blank NPs, DTX, DTX/CA-Oxi-αCD NPs and DTX/FA-CA-Oxi-αCD NPs at the same doses of 5 mg/kg of DTX (n = 5). (A) Scheme illustration of the pulmonary metastasis inhibition experiment design. (B) In vivo bioluminescent images of the mice treated with DTX and various NPs. (C) The bioluminescence images of the ex vivo major organs from mice after different treatments. (D) Bioluminescence intensity in the lung of mice after different treatments in vivo. (E) Bioluminescence intensity of the ex vivo lungs in the mice after different treatments. (F) The photo images of ex vivo lungs in the mice treated with DTX and various NPs. (G) Representative microphotographs of H&E sections of lungs in the mice treated with DTX and various NPs. Scale bar represents 50 μm. (I) PBS, (II) Blank NPs, (III) DTX, (IV) DTX/CA-Oxi-αCD NPs, (V) DTX/FA-CA-Oxi-αCD NPs. *p < 0.05, **p < 0.01, and ***p < 0.001, compared with DTX/ FA-CA-Oxi-αCD NPs (n = 5)

