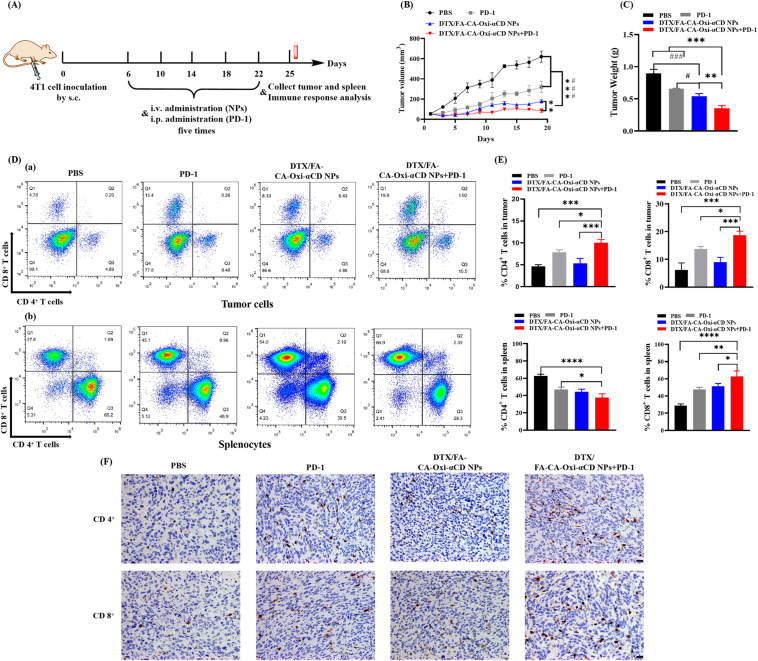
Fig. 9.
The antitumor ability of chemotherapy and immunotherapy combination therapy and the ability to stimulate antitumor immune responses in vivo. (A) Scheme illustration of the chemotherapy and immunotherapy combination treatment. (B) Tumor growth curves of mice after different treatments. (C) The tumor weight of mice in different treatment groups. (D) (a) Representative flow cytometric plots of CD8+ T cells and CD4+ T cells from mouse tumors after different treatments. (b) Representative flow cytometric plots of CD8+ T cells and CD4+ T cells from mouse splenocytes after different treatments. (E) Proportions of CD8+ T cells and CD4+ T cells from tumors or splenocytes were determined by flow cytometry after different treatments, respectively. (F) The immunohistochemical staining of CD8+ T and CD4+ T cells in mice tumors after different treatments. Brown regions indicate the presence of CD8+ T cells or CD4+ T cells. Scale bar represents 20 μm. *p < 0.05, **p < 0.01, ***p < 0.001 and ****p < 0.0001, compared with DTX/FA-CA-Oxi-αCD NPs + anti-PD-1 antibody. #p < 0.05, ##p < 0.01, ###p < 0.001, compared with DTX/FA-CA-Oxi-αCD NPs

