Fig. 3.
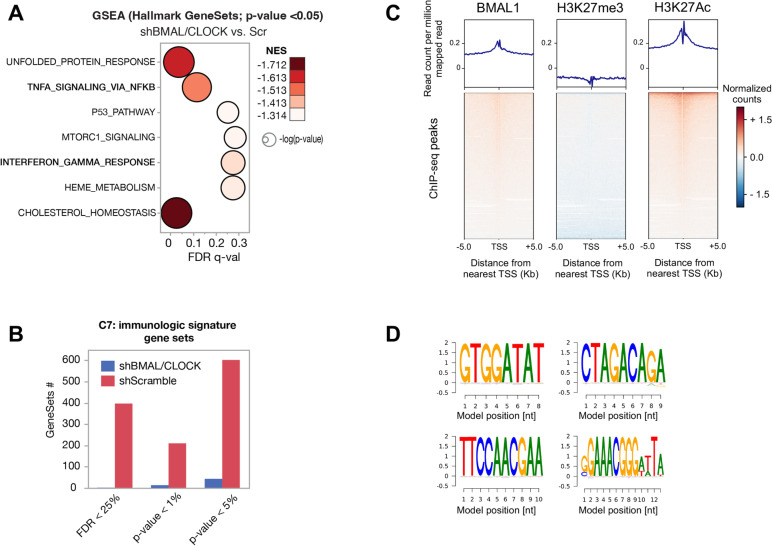
CLOCK and BMAL1 transcription factors promote the expression of genes involved in inflammatory pathways in T-ALL. A Bubble plot of the Hallmark GeneSets found negatively enriched in shBMAL1/CLOCK condition by Gene Set Enrichment Analysis (GSEA). Colors of the bubbles represent the magnitude of enrichment (NES, normalized enrichment score) and are as per the legend. Size of the bubbles represents the statistical significance of the enrichment (FDR, false-discovery-rate based on 1000 random permutation), i.e., the bigger the most significant and are as per the legend. Y-axes, Gene Sets. X-axes, FDR of enrichment significance. B Bar plots represent the number of immunological Gene Sets (C7) enriched in T-ALL cells in the different conditions as per the legend. X-axes, indicate the different statistical significance of the enriched Gene Sets. C Average plot (top) and heatmap (bottom) of ChIP-Seq reads for BMAL1, H3K27me3 and H3K27Ac around the transcriptional starting site (TSS) in RPMI-8402 cell line. Upper panels show the average profile ± 5 kb around the centered TSS. Lower panels show read density heatmaps around the detected peak centers. Scales indicate normalized counts in the ChIP-Seq signal. D Position Weighted Matrix (PWM) logo identified by the BAMM suite platform (https://bammmotif.soedinglab.org/seed_results/423b6b96-fc2c-4ae3-a248-c2ea4a8eed7c/). The DNA motifs in the analyzed ChIP-seq data include the most frequent sites for BMAL1 in RPMI-8402 cell line

