Fig. 5.
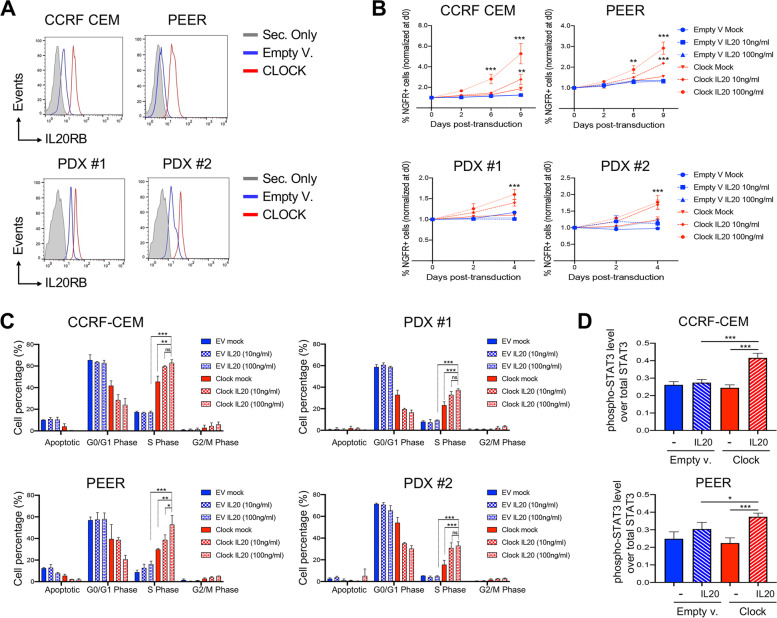
CLOCK promotes cell proliferation in T-ALL cells through IL20R signaling. A Protein expression level of IL20RB by flow cytometry in CCRF-CEM and PEER cell lines and PDX models transduced with CLOCK or empty (EV) lentivectors with truncated human NGFR (tNGFR) selection marker. NGFR + alive cells were measured after three days from the transduction and identified for DAPI exclusion by flow cytometry. B Flow cytometry analysis of abundance of NGFR + alive cell fraction after transduction with CLOCK or empty (EV) lentivectors as reported in (A) and following treatments with IL20 at the indicated concentration (10 ng/ml and 100 ng/ml) or phosphate-buffered saline (PBS) as mock control. Transduced subsets of CCRF-CEM and PEER cell lines and PDX models were tracked over time at the indicated time points by flow cytometry. Alive NGRF + cells were discriminated for DAPI exclusion. Means ± SD fraction of the initial transduction value are plotted for experiments performed in triplicate. **, p < 0.01; ***, p < 0.001 (Two-way ANOVA with Dunnett's test, comparing the mean of CLOCK-transduced IL20-treated cells, with the other values). C Flow cytometric analysis of cell proliferation by BrdU incorporation in human CCRF-CEM and PEER cell lines and PDXs, following transduction with CLOCK or empty lentivectors as indicated. Transduced cells were treated with IL20 or mock control as reported in (B) and measured after three days of in vitro IL20 stimulation by flow cytometry. The graphs report the result of two independent experiments performed in triplicate. ns, not significant; **, p < 0.05; **, p < 0.01; ***, p < 0.001 (Student's t-test). D Protein expression level of total and phosphorylated proteins of STAT3 in CCRF-CEM and PEER cell lines transduced with CLOCK or empty lentivectors and following 72 h incubation with or without IL20 as indicated Each graph reports the ratio of mean fluorescence intensity (MFI) of phosphorylated protein over the MFI of total protein in two independent experiments. *, p < 0.05; **, p < 0.01; ***, p < 0.001 (Student's t-test)

