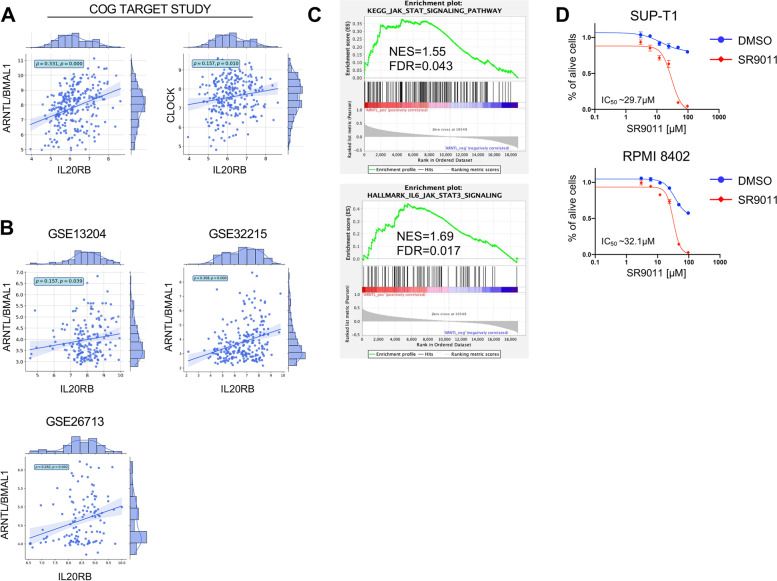
Fig. 6.
Primary patient T-ALL samples with high ARNTL mRNA level have high gene expression of L20RB transcript ad well as genes related to JAK/STAT signaling pathway. A Correlation analysis for ARNTL/BMAL1 vs. IL20RB and CLOCK vs. IL20RB mRNA expression level (normalized rLog) among 264 T-ALL patients from the COG TARGET study [4]. Pearson correlation coefficient (ρ) and pValue (p) are also reported in the plot. B Correlation analysis for ARNTL/BMAL1 and IL20RB expression level (normalized with RMA (Robust Multiarray Averaging) Affymetrix microarray (HG-U133 Plus 2.0) data was downloaded from Gene Expression Omnibus (accessions GEO: GSE13204 (n = 174), GSE32215 (n = 228) and GSE26713 (n = 117)). Probe sets for ARNTL/BMAL1 and IL20RB were identified using a custom CDF file. Pearson correlation coefficient (ρ) and pValue (p) are also reported in the plot. C Gene set enrichment analysis (GSEA). The gene signature was derived from the differential expression analysis of RNA-seq data sets from the COG TARGET study [4]. All genes were ranked for the differential expression of ARNTL/BMAL1 gene in high vs. low T-ALL patients. NES, normalized enrichment score; FDR, false discovery rate. D Dose–response curve showing relative viability (y axis) of human SUP-T1 and RPMI-8402 cell lines treated in vitro with variable concentrations of SR9011 agonist of the nuclear hormone receptors Rev-Erbα and Rev-Erbβ and inhibitor of BMAL1 transcription (x axis) (n = 3). Viable cells were measured after 72 h of treatment with DMSO (mock) or SR9011 at the indicated concentrations by flow cytometry analysis for DRAQ7 exclusion. The graphs report the result of two independent experiments performed in duplicates (mean ± SD are plotted)

