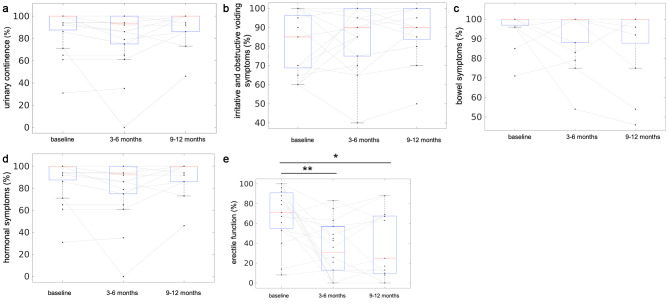
Fig. 3.
Functional assessment over a Follow-up period of 12 months using the Expanded Prostate Cancer Index Composite (EPIC) score. Depicted are results of functional assessment at baseline and up to 12 months after TULSA for urinary continence (a), irritative and obstructive voiding symptoms (b), bowel symptoms (c), hormonal symptoms (d) and erectile function (e). Red lines with blue boxes represent the group median with interquartile range for the corresponding data. Each black dot represents one patient at one time point and black dots of the same patient are connected with grey lines to present the individual development of functional parameters over time

