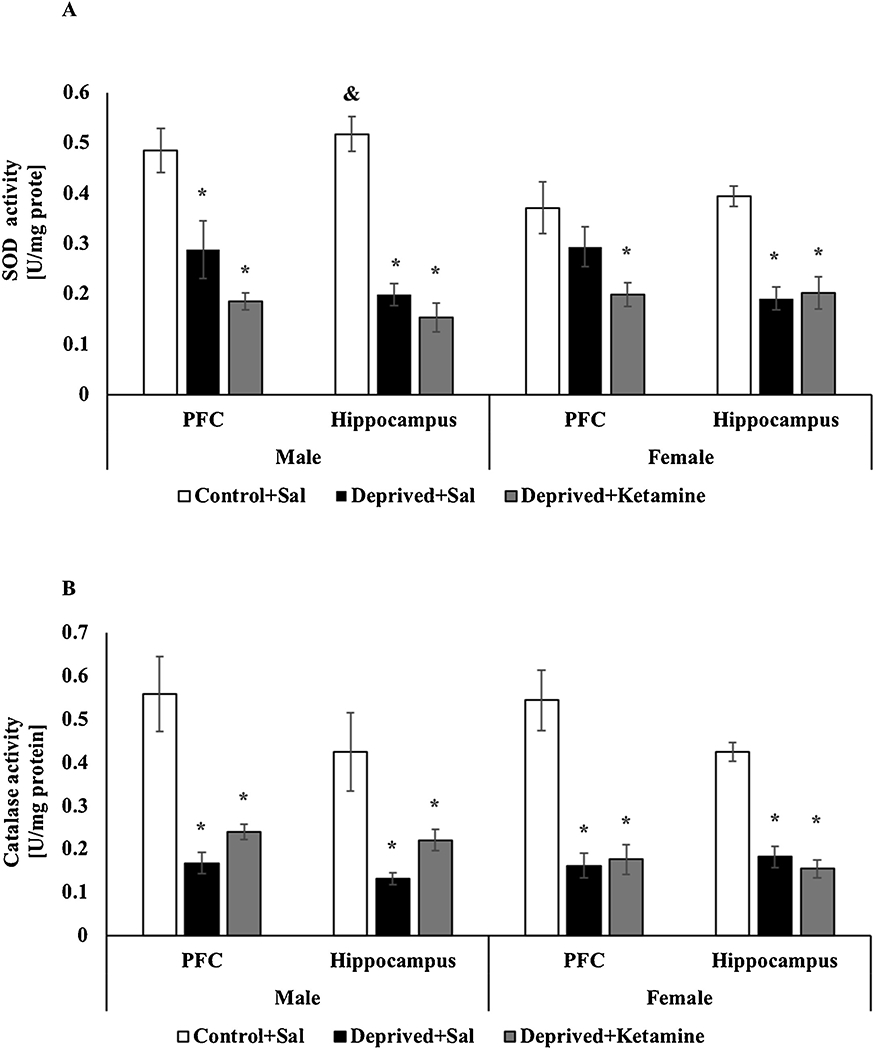
Fig. 3.

A: Effects of MD and ketamine treatment on SOD activity in PFC and hippocampus of male and female Wistar rats. Values are expressed as mean ± E.P.M. * p < 0.05 vs. Control + Sal, according to one-way ANOVA followed by Tukey’s post-hoc test; &p<0.05 vs. sex and groups interaction according to two-way ANOVA. B: Effects of MD and ketamine treatment on CAT activity in PFC and hippocampus of male and female Wistar rats. Values are expressed as mean ± E.P.M. * p < 0.05 vs. Control + Sal, according to one-way ANOVA followed by Tukey’s post-hoc test.
