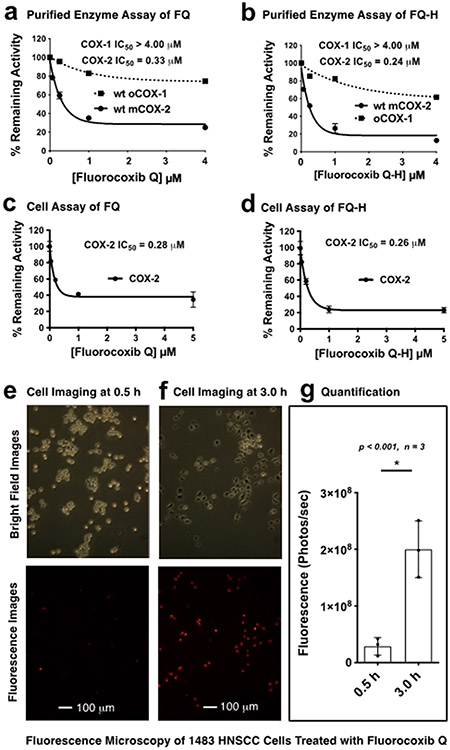
Figure 3. Evaluation of FQ.
(a,b) Purified oCOX-1 and mCOX-2 isozyme inhibition by FQ and FQ-H, respectively; (c,d) cell-based (1483 HNSCC cells) COX-2 inhibition by FQ and FQ-H, respectively; (e-f) 1483 HNSCC cells were treated with FQ followed by fluorescence microscopy at 0.5 h and 3 h post-incubation; (g) cell fluorescence was measured on a BioTek Synergy MX Plate Reader, and Welch’s correction was performed for an unpaired parametric t test performed to assess statistical difference, where the error bars represent standard error.

