Figure 4.
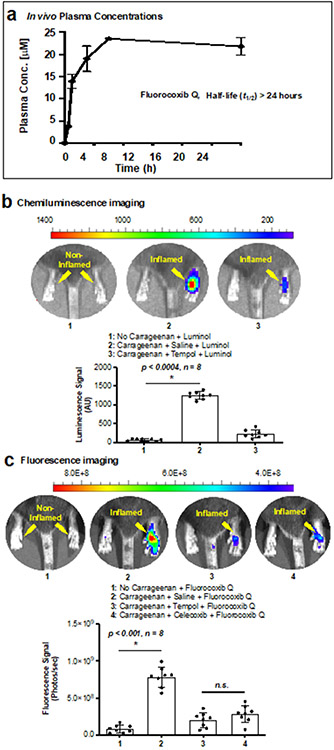
In vivo experiments. FQ plasma concentration versus time is shown in (a); the half-life exceeds 24 h. (b-c) chemiluminescence imaging of carrageenan-induced mouse footpad inflammation using luminol with saline or TEMPOL pre-treated animals, and fluorescence imaging of mouse footpad inflammation using FQ with saline, TEMPOL or celecoxib pre-treated animals. We used an ImageJ software to measure fluorescence at the regions of interest. We performed a Welch’s correction to assess statistical difference. The error bars represent standard error and n.s. stand for not significant.

