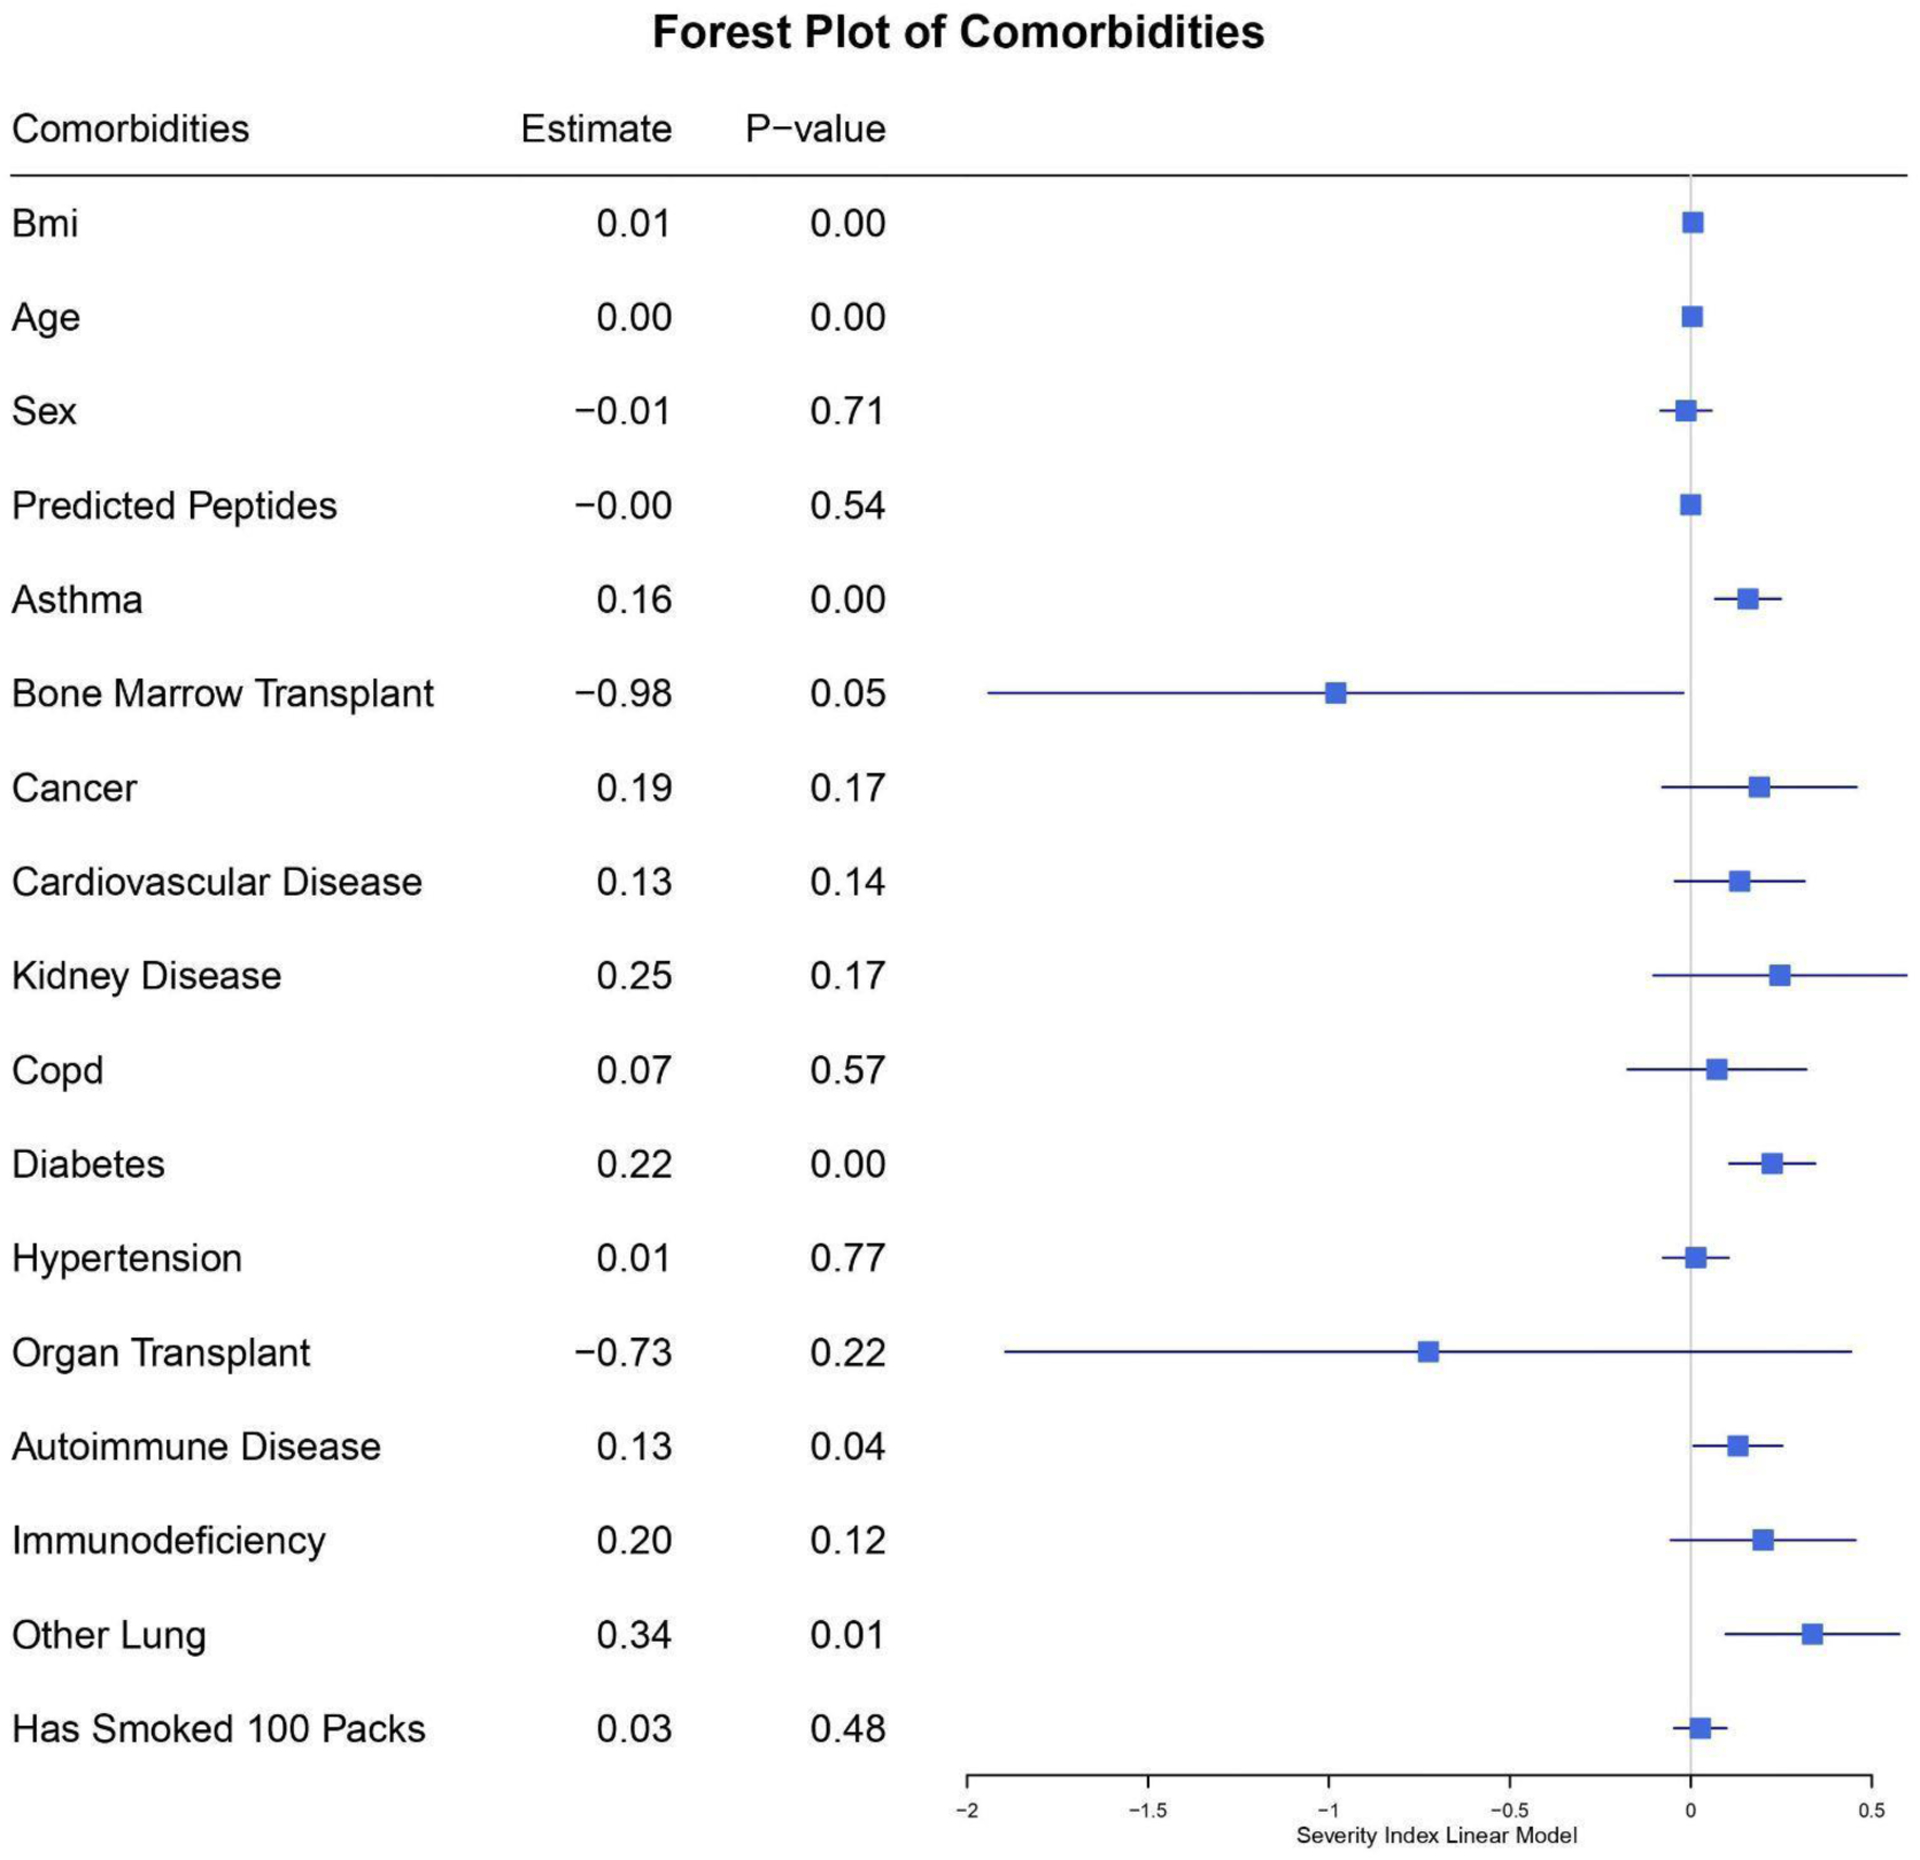
Figure 1:

Forest plot of comorbidities including putative viral peptide presentation as a function of HLA type (Predicted Peptides) in the pooled multivariate model for predicting severity score. The estimate column shows the coefficients of variables in the linear model. Each line represents the 95% confidence interval for the estimate value. For the sex variable, female is 1 and male is 0. Positive values for the estimate are predicted to contribute to a higher severity score and vice versa for negative values.
