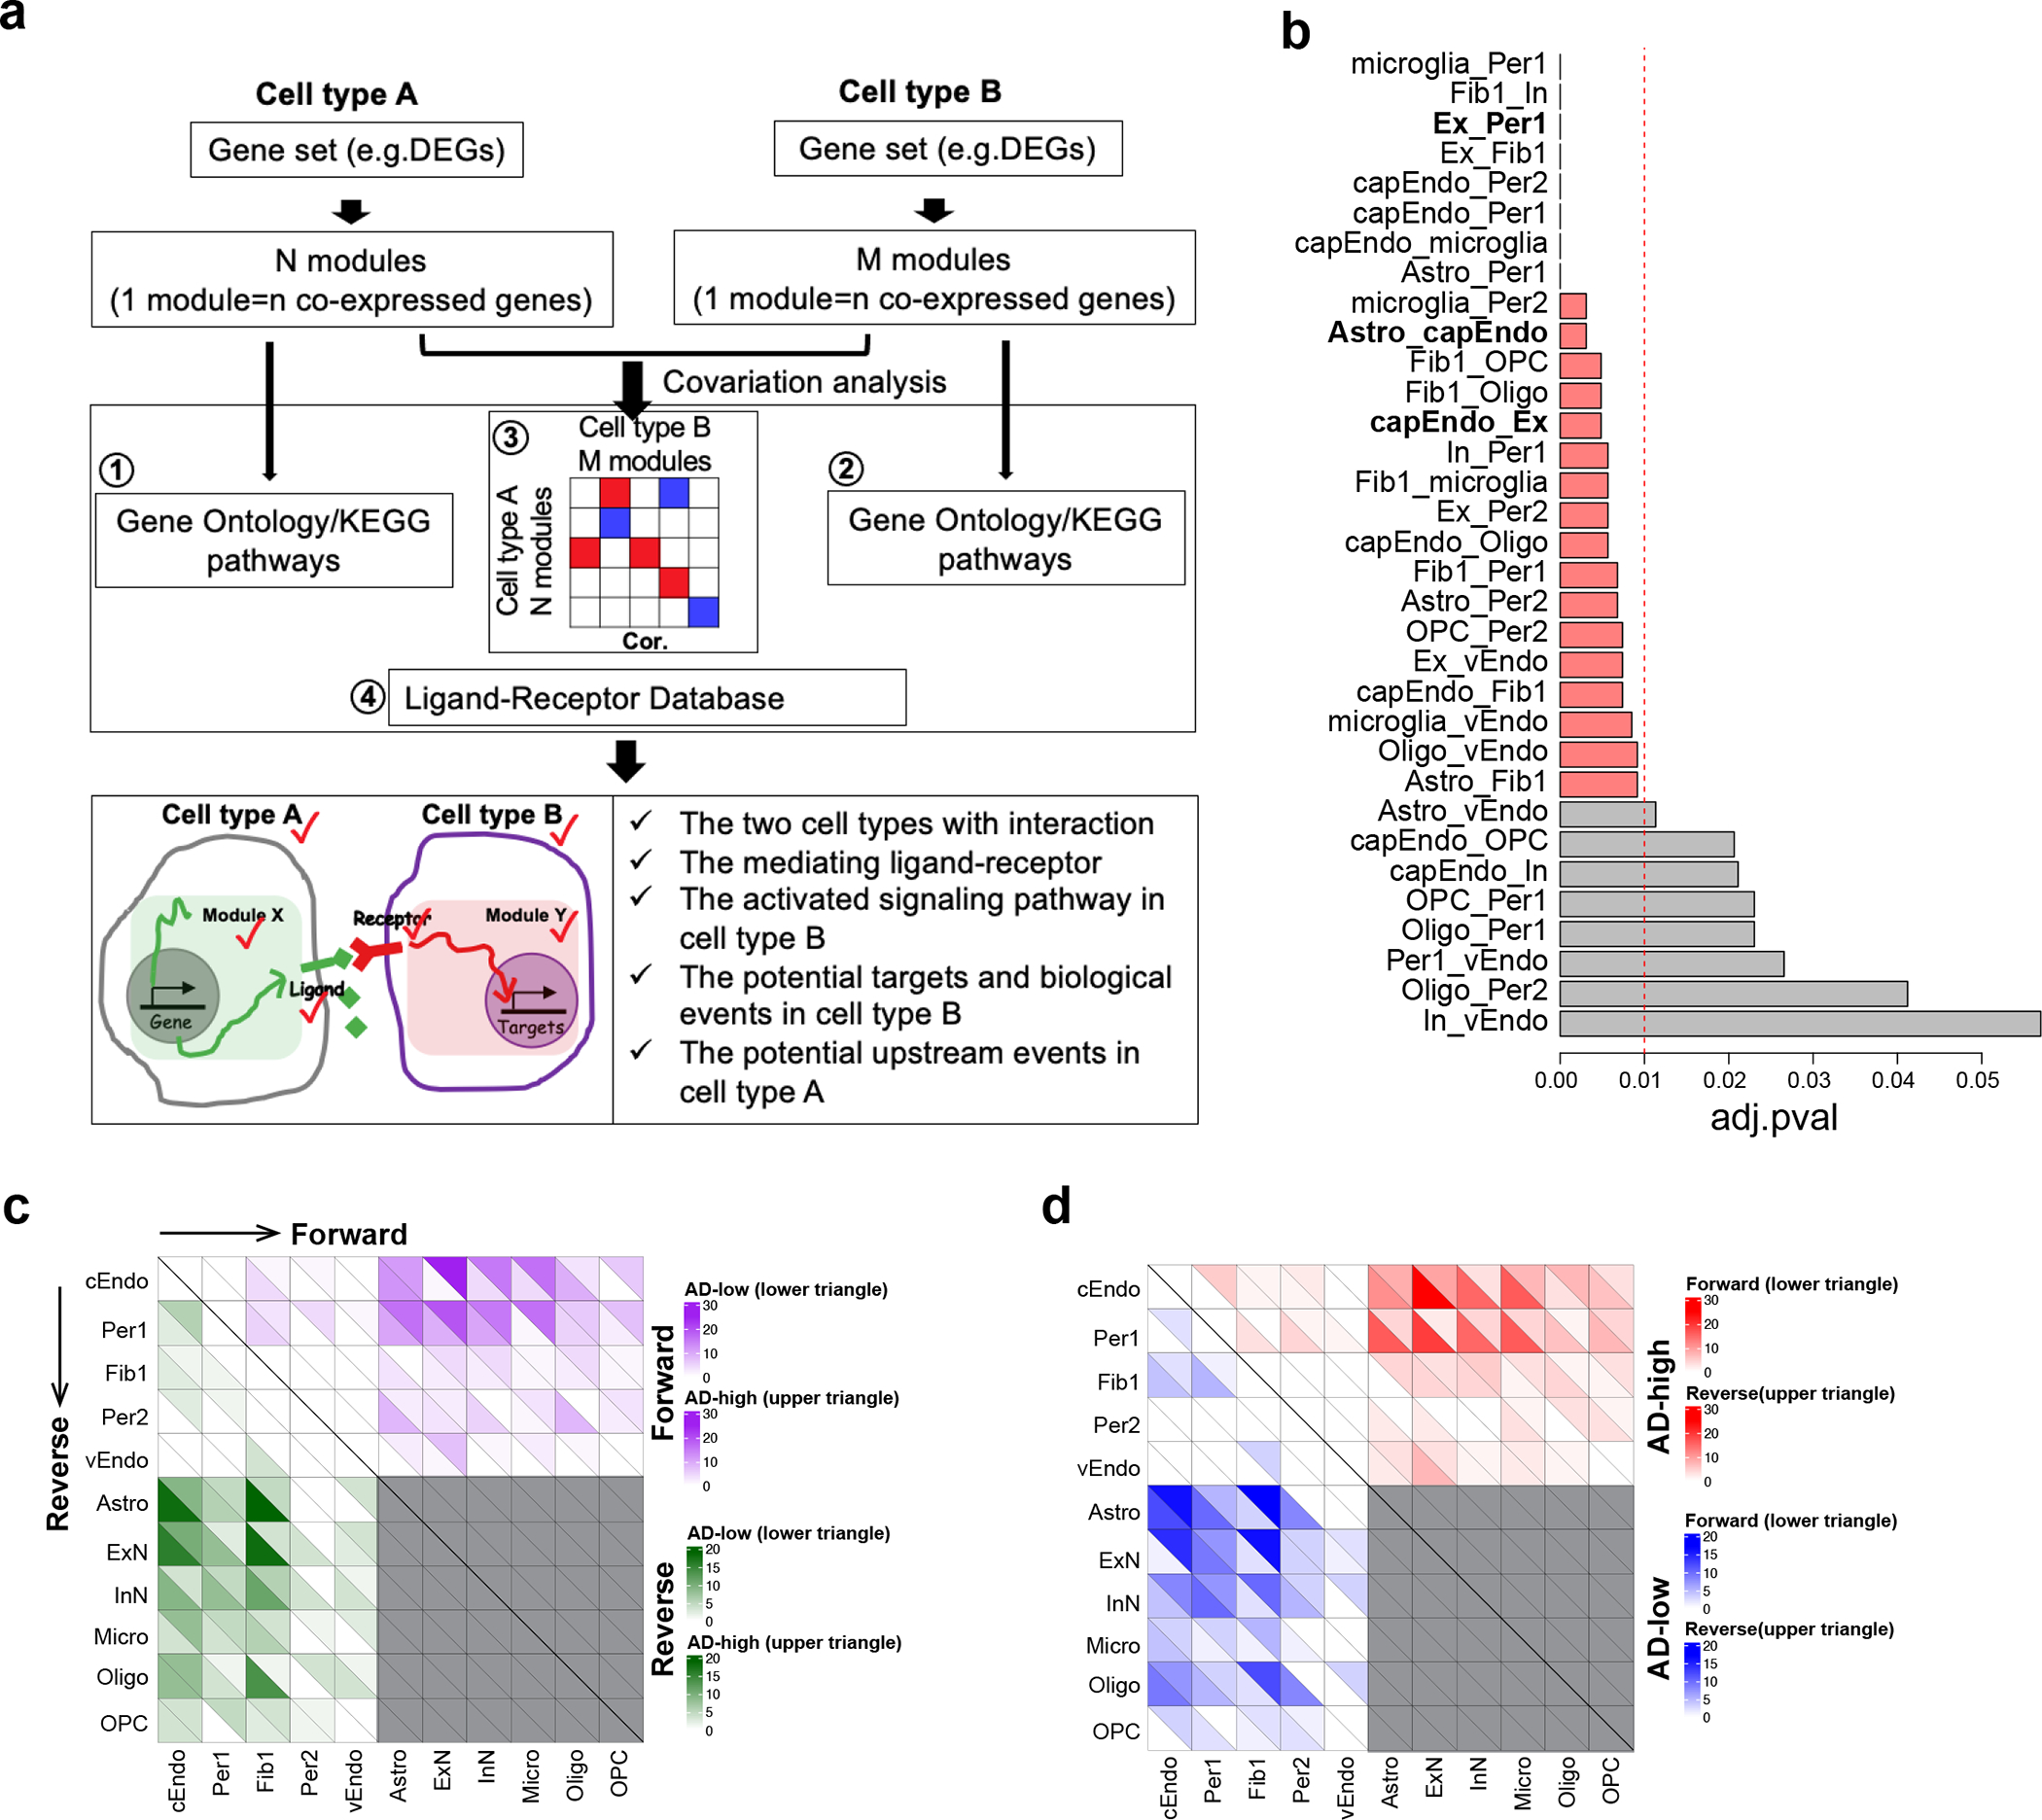
Extended Data Figure 8. Dynamics of cell-cell communications between vascular cell types and neuron/glial cells in AD.

a. Computational framework to infer cell-cell communications. For each cell type, a set of genes was clustered into a number of co-expressed modules. The pairwise Pearson correlation coefficient was calculated between modules for each pair of cell types. The significantly correlated modules, functional enrichment, and ligand-receptor pairs were integrated into the prediction of cell-cell communication. The output includes the interacting cell types, ligand, ligand-involved functions, receptor, receptor-involved functions, potential targets in signal receiver cell type, and direction of cell-cell communication (as determined by the changes of ligand-receptor and their co-expressed genes in the same module) in AD. b. Barplot showing the statistical significance of the cell-cell communications, as represented by the adjusted p-value using a permutation test in each pair of interacting cell types. An adjusted p-value of 0.01 (dashed line) was used as a cutoff. The three cell pairs which had the most cell-cell communication (Ex_Per1, Astro_cEndo and cEndo_Ex) are highlighted in bold. c. Heatmap showing the up- and down-regulation of both forward and reverse cell-cell communications in AD. The purple indicates the number of forward interactions (from cell type on the left of the plot to cell type on the bottom of the plot) that were upregulated in AD (upper triangle in each square) and downregulated in AD (lower triangle in each square). The green indicates the number of reverse interactions (from the cell type on the bottom of the plot to the cell type on the left of the plot) that were upregulated in AD (upper triangle in each square) and downregulated in AD (lower triangle in each square). d. Heatmap showing the forward and reverse cell-cell communications that are both up- and down-regulated in AD. The red indicates the number of upregulated interactions in AD that are forward interactions (from cell type on the left of the plot to cell type on the bottom of the plot, lower triangle) and reverse interactions (from the cell type on the bottom of the plot to the cell type on the left of the plot, upper triangle). The blue indicates the number of downregulated interactions in AD that are forward interactions (from cell type on the left of the plot to cell type on the bottom of the plot, lower triangle) and reverse interactions (from the cell type on the bottom of the plot to the cell type on the left of the plot, upper triangle).
