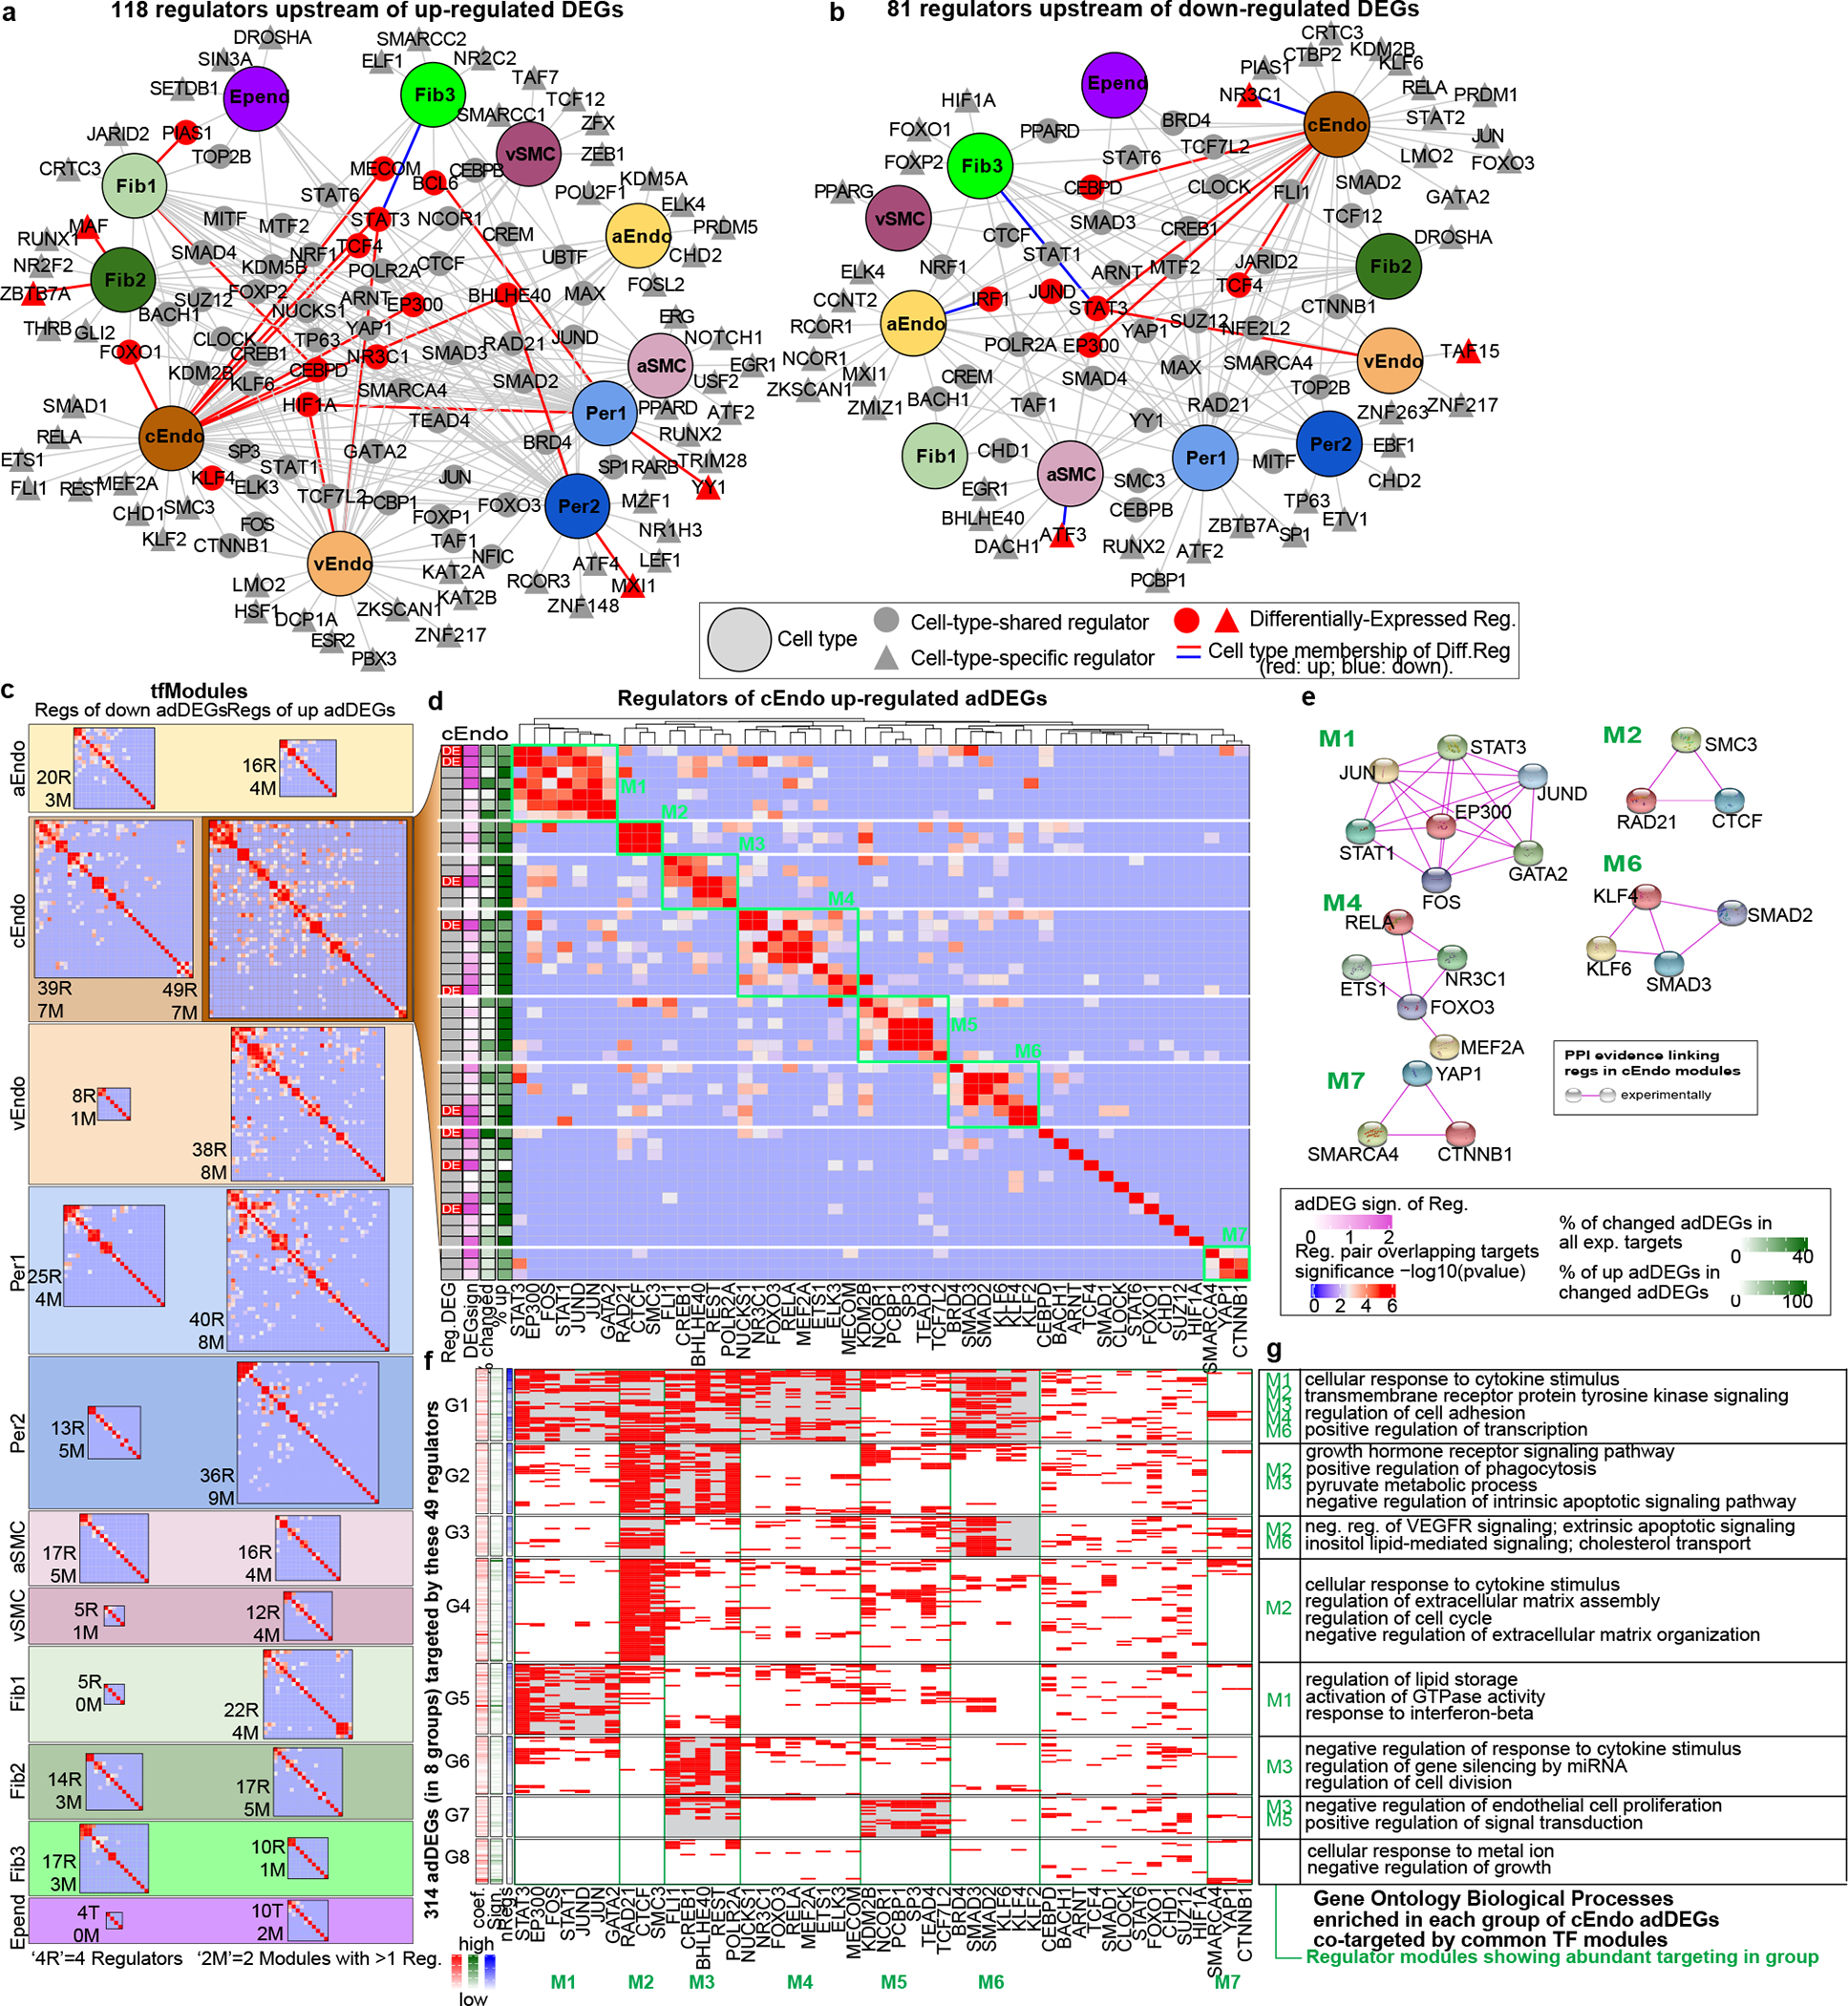
Figure 3.

Upstream regulators of differentially expressed genes in AD. a-b. Regulator-cell type networks in upregulated (a) and down-regulated (b) adDEGs. Enrichr is used to predict regulators (proportion test, adjusted p-value < 0.05 as cut-off). The large nodes represent cell types. Triangle nodes represent cell type specific regulators. Gray nodes represent regulators with expression but not differentially expressed. Red nodes represent differentially expressed regulators. Red edges represent the corresponding differentially expressed regulators in relevant cell types. c. Overview of heatmaps to show co-regulatory tfModules for all adDEGs sets (up and down for each cell type). For each cell type, there are two heatmaps to show the tfModules (up adDEGs and down adDEGs). The size of each heatmap reflects the number of regulators. The values in the heatmap are −log10(p-value) to represent the significance of overlapping targets between regulators as (d). Fisher’s exact test is used (adjusted p-value < 0.05 as cutoff) d. Co-regulatory modules of upregulated adDEGs in capillary endothelial cells (cEndo). Seven modules are boxed in green. The values in the heatmap are the significance of overlapping targets between regulators (−log10(p-value)) as (c). On the left, column 1: the regulator is differentially expressed; 2: differential significance ; 3: the percentage of targeted adDEGs in all targets of each regulator and the percentage of targeted upregulated adDGEs in all targeted adDEGs. e. Physical protein-protein interaction networks for 5 of 7 co-regulatory modules. f. Heatmap showing the eight adDEG groups that were targeted by regulators shown in (d). Red indicates that a gene in a row is targeted by the regulator in the column. The gray shaded blocks highlight the regulation of specific co-regulatory modules on
