
Figure 6.
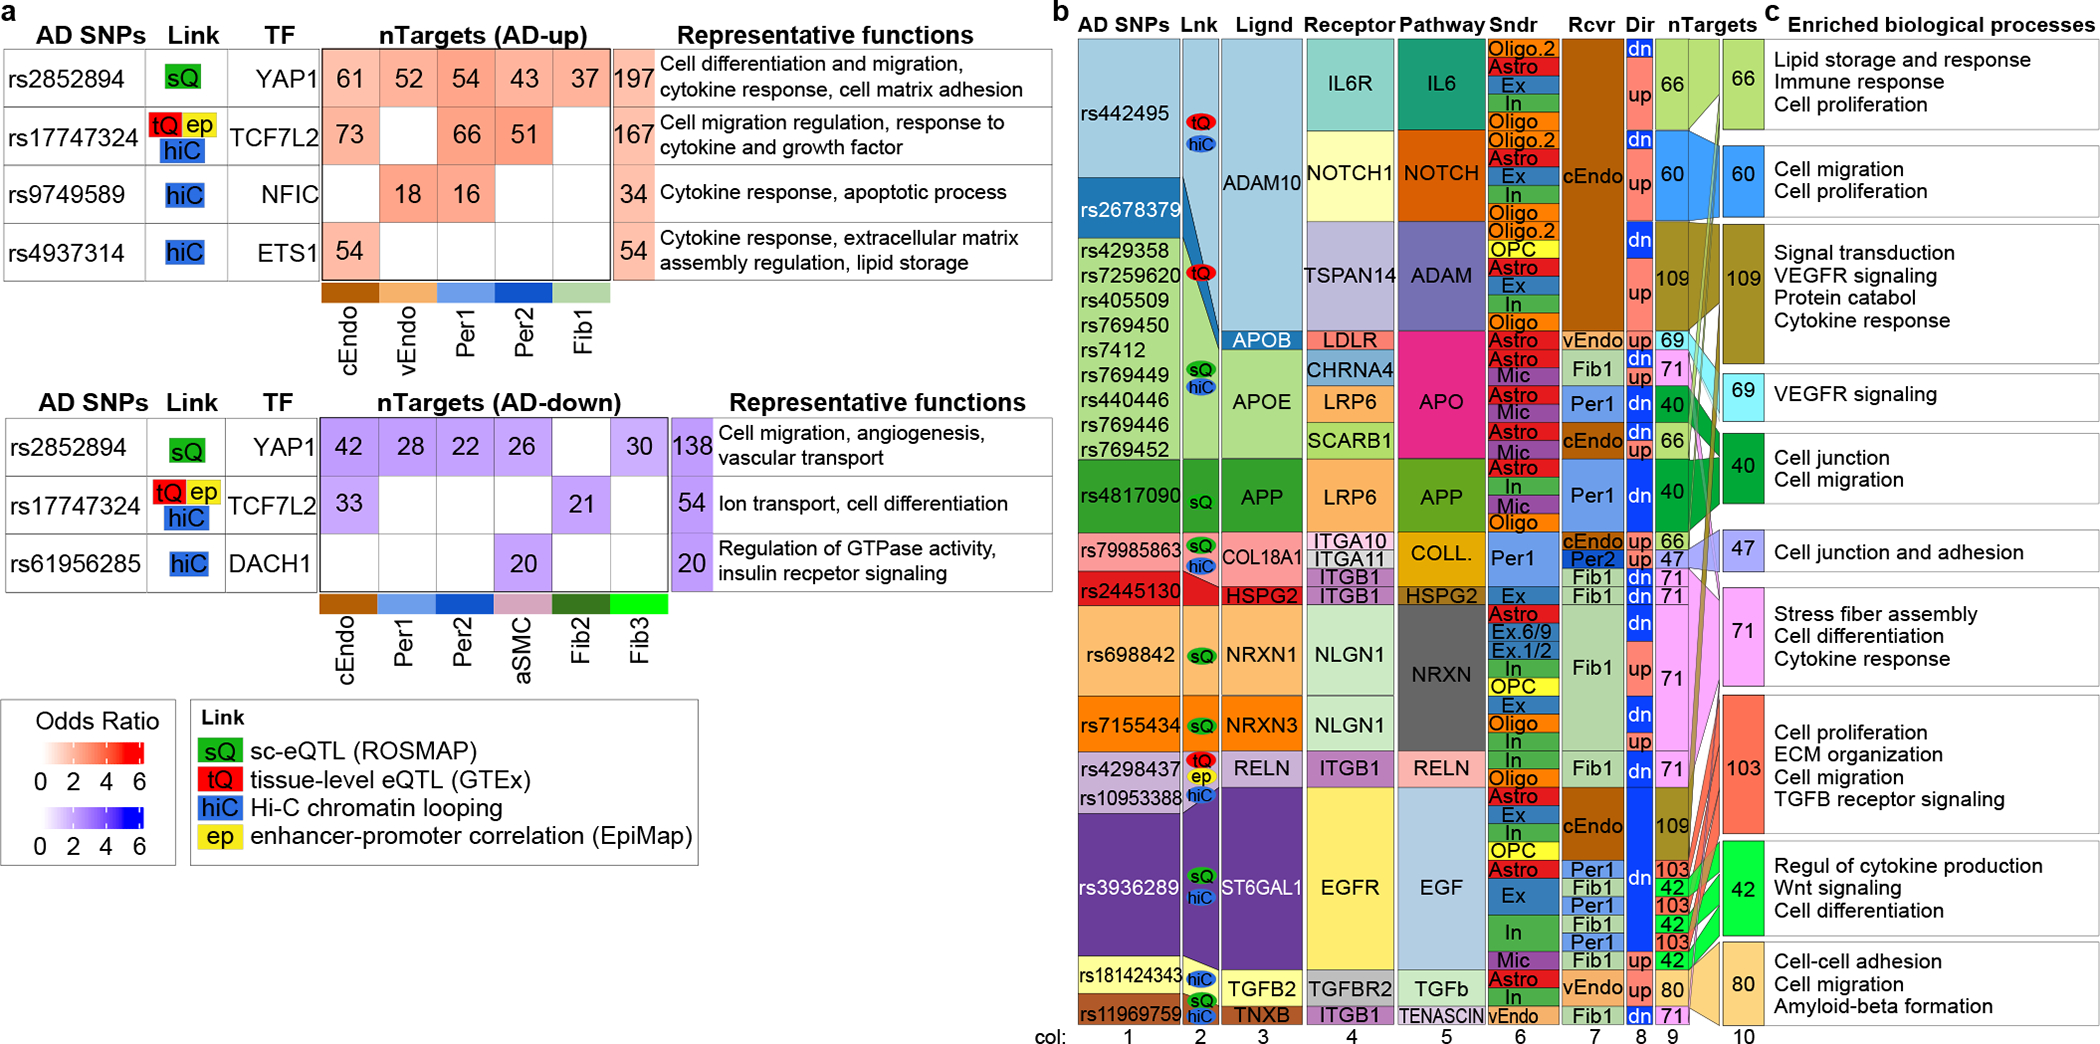
AD GWAS loci indirectly linked to brain vascular adDEG. a. Summary of AD-associated transcription factors: AD-variants, linking evidence, transcription factor, the number of targets in adDEGs for each cell type and summation in all cell types, and representative functions of these targets. The color scale for odds ratio in red/blue refers to the enrichment of up-/down-regulated adDEGs in the regulator’s targets. b. Summary of AD-associated ligands: AD-variants, linking evidence, ligand, receptor, signaling pathway, sender cell type, receiver cell type, differential direction in AD, and number of targeted adDEGs. The colors are matched for the columns of AD-variants, linking evidence, and ligand to show the correspondence between AD-variants and associated ligands. The colors of the sender (“Sndr”) and receiver (“Rcvr”) cell types match the cell types shown in Figure 5c–d. The columns are horizontally aligned to show the correspondence. c. The enriched biological processes of targets shown in (b) and the targets involved in the specific function. Enrichr in R was used to perform GO enrichment